Ottawa vs Fort Worth: which should you move to?
Ottawa or Fort Worth? Housing, rent, crime, climate, income, taxes and transit, side by side, from each city's own published figures. Written for someone deciding where to live, not for a ranking.
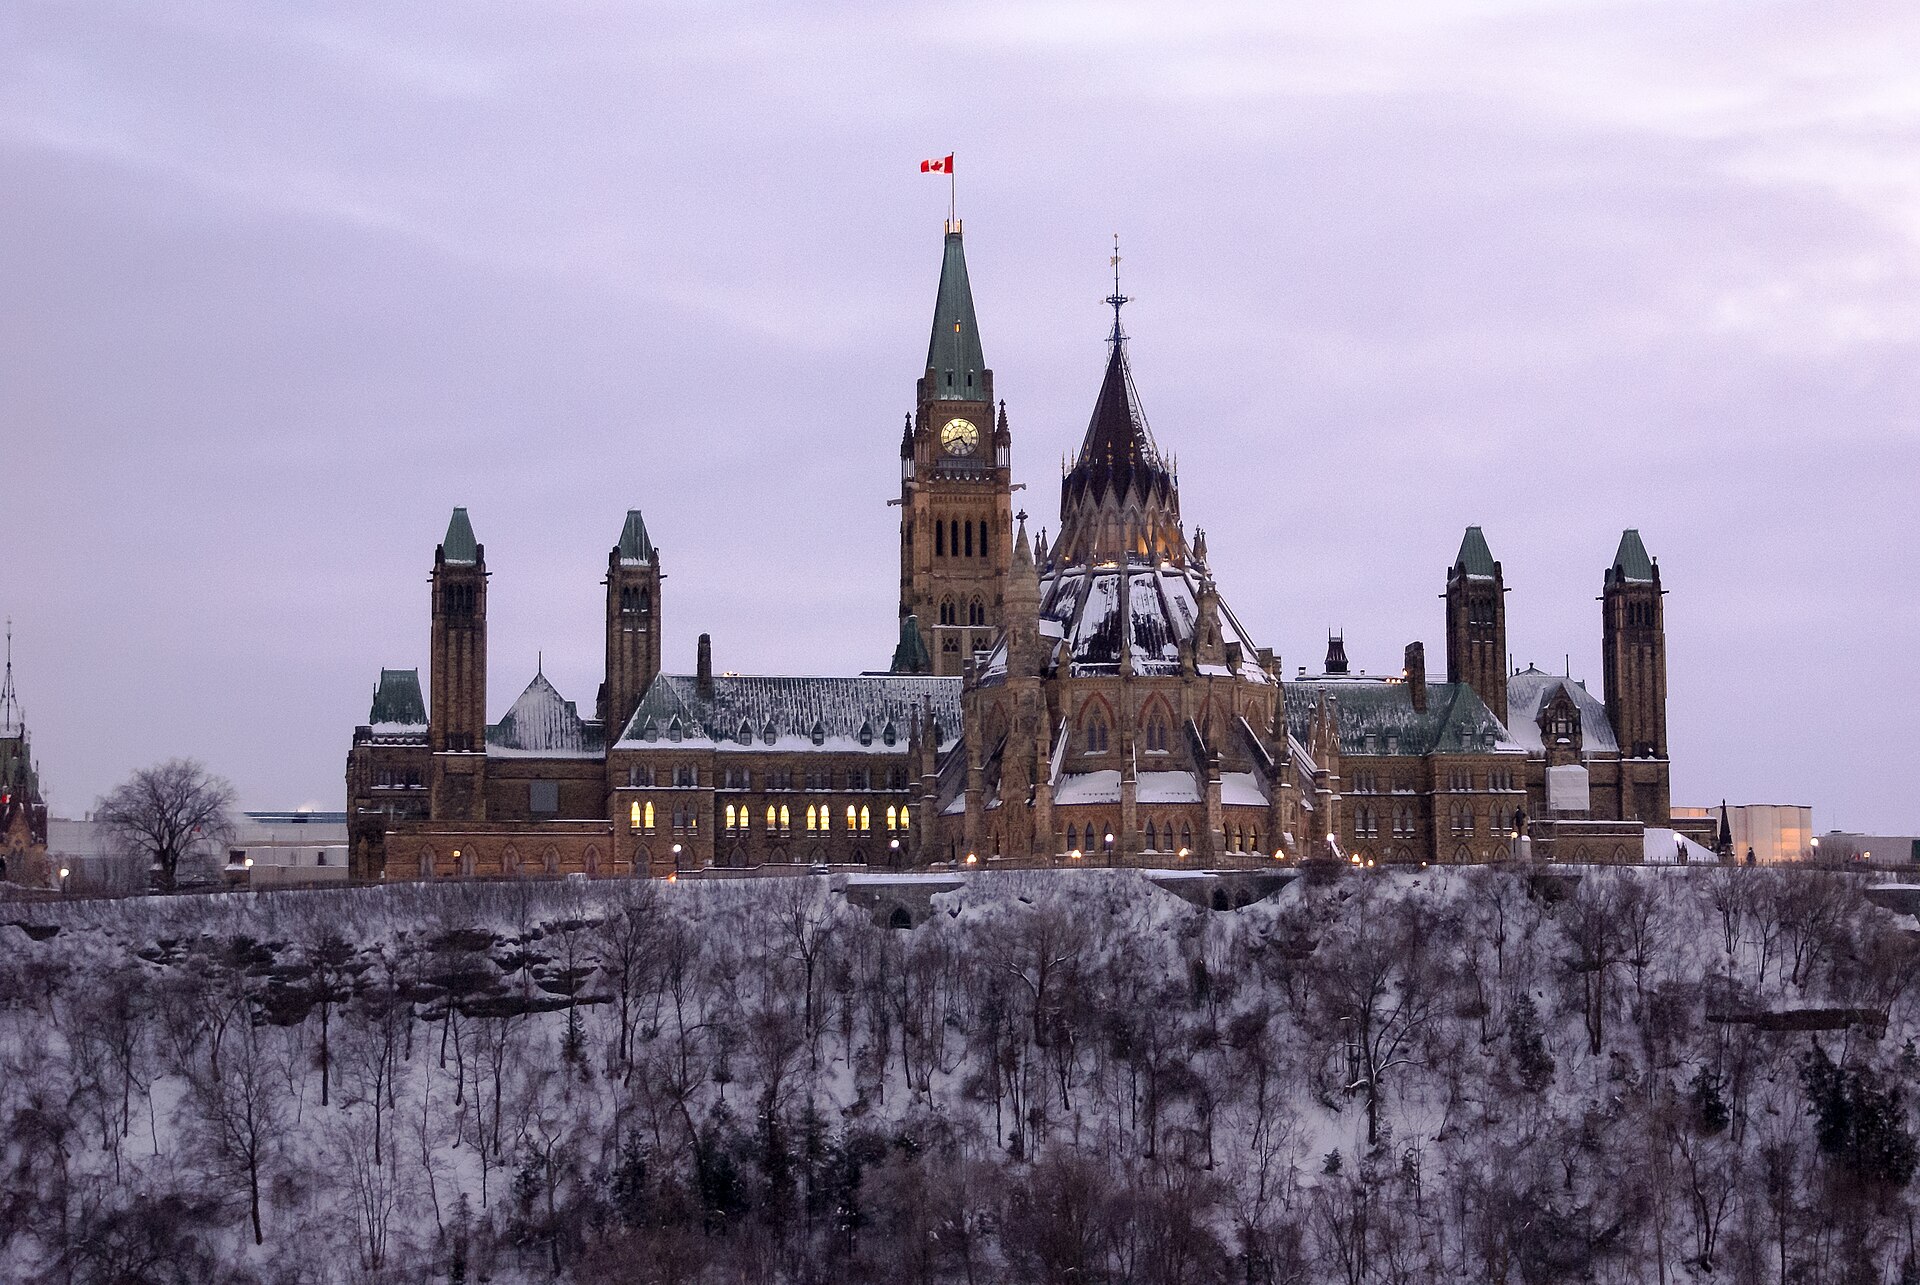
Ottawa
.jpg)

Fort Worth

The two housing bills are in different currencies, and held against local pay they come out almost level. Ottawa's composite benchmark is 6.2 times local median household income and Fort Worth's median single-family sale price about 4.0 times, yet mortgage, property tax and insurance come to about $3,350 CAD a month in Ottawa, roughly 39% of the city's 2020 median, and about $2,516 USD in Fort Worth, roughly 37% of its 2024 median. The cheaper Fort Worth house costs nearly as large a share to hold because of a 7.03% mortgage rate against 4.34%, a property tax of 1.54% against 0.83% and insurance of $350 USD a month against $145 CAD, which is how Texas collects what it does not take in income tax and how North Texas prices hail. Fort Worth, the western half of the Dallas-Fort Worth metro, has the lower unemployment rate on its own measure and DFW, the airport it shares with Dallas; Ottawa has the transit and, by a wide margin, the lower homicide rate, 21 in 2025 at 1.59 per 100,000 against 78 at about 7.6. Choose Ottawa for coverage that comes with residency, French schooling and a mild summer. Choose Fort Worth for the job market, a 7.7 C January and a salary taxed only by Washington.
Ottawa prices are in CAD and Fort Worth prices are in USD. The tables leave them in their own currency and compare ratios and rates instead; a conversion would be stale by the time you read it.
| Measure | Ottawa | Fort Worth | Advantage |
|---|---|---|---|
| City population | 1,188,114 (2025) | 1,028,117 (2025) | Not directly comparable |
| Metro population | 1,700,014 (2025) | 8,477,157 (2025) | Not directly comparable |
| Five-year growth Growth is pressure on rents and roads as much as it is opportunity, so it is reported without a winner. | 8.9% (2016-2021) | 11.9% (2020-2025) | Not directly comparable |
What a home costs in each
The figures the two cities' rent-versus-buy and mortgage calculators run on, read from the same tables.
| Measure | Ottawa | Fort Worth | Advantage |
|---|---|---|---|
| Benchmark home price MLS® HPI or equivalent benchmark. Lower is treated as the advantage, which is the buyer's view rather than the owner's. | $634,000 (July 2026) | $327,000 (August 2026) | Not directly comparable |
| Detached house benchmark Fort Worth publishes a single house index rather than a composite, so the two rows repeat. | $725,000 | $327,000 | Not directly comparable |
| Apartment or condominium benchmark | $385,500 | $330,000 | Not directly comparable |
| Two-bedroom rent | $1,916/mo (average, October 2025) | $1,317/mo (median, September 2026) | Not directly comparable |
| One-bedroom rent | $1,593/mo | $1,141/mo | Not directly comparable |
| Two-bedroom rent against median income A year of two-bedroom rent as a share of the median household income below. A household paying the median rent out of the median income is a fiction, but it is the same fiction in both columns and it crosses currencies. | 22.5% of a year's income | 19.2% of a year's income | Fort Worth |
| Mortgage payment on the benchmark, 20% down 25 years in Ottawa against 30 in Fort Worth, each compounding the way its own country's lenders do. The rates are not a spread you can shop: they are what each market charges. | $2,762/mo at 4.34% | $1,746/mo at 7.03% | Not directly comparable |
| Price to household income Benchmark price divided by the median household income below. A ratio is comparable across currencies; the dollars are not. | 6.2× | 4.0× | Fort Worth |
| Property tax on the benchmark home The effective rate on market value, which is what the two rates have in common and what the Advantage column is decided on; the bills are in each city's own dollars. | $5,262/yr (0.83%, 2026) | $5,046/yr (1.543%, 2025) | Ottawa |
| Transfer tax on the benchmark home Compared as a share of the price. Where the seller pays it, it is a cost of leaving rather than arriving. | $9,155 (buyer pays) | None | Fort Worth |
| Rent control A cap protects a sitting tenant and does nothing for the next lease, so neither column is simply better. | 2.1% guideline (2026) | Forbidden by state law | Not directly comparable |
Ottawa: About 0.83% of market value. Ottawa levies roughly 1.26%, but against a Current Value Assessment frozen at 1 January 2016 values, because Ontario has deferred every reassessment since. The average urban home is assessed at $415,000 and pays about $5,246 in 2026, which on the $634,000 composite benchmark is 0.83%. Ottawa's municipal taxes on a representative detached house were the lowest of Ontario's ten largest cities in 2025. Fort Worth: About 1.54% of value for a homesteaded owner, worked out on the $327,000 median single-family sale price. A house in the City of Fort Worth and Fort Worth ISD, the school district more of the city's residents live in than any other, is taxed by six units for 2025, which add to 2.18908 per $100 before any exemption. Each takes its own homestead exemption off the appraised value first, except one: Fort Worth ISD takes the state's $140,000 and nothing more, Tarrant County College 1% with the state's $5,000 floor, Tarrant County, the City and JPS Health Network 20% each, and the Tarrant Regional Water District, which pays for the Fort Worth Floodway, none at all. So Tarrant County levies 0.1862 per $100 on $261,600 after an exemption of $65,400, $487; City of Fort Worth levies 0.67 per $100 on $261,600 after an exemption of $65,400, $1,753; Fort Worth ISD levies 1.0291 per $100 on $187,000 after an exemption of $140,000, $1,924; Tarrant County College levies 0.11228 per $100 on $322,000 after an exemption of $5,000, $362; JPS Health Network levies 0.165 per $100 on $261,600 after an exemption of $65,400, $432; Tarrant Regional Water District levies 0.0265 per $100 on the full $327,000, with no homestead exemption, $87. The six come to $5,044 a year, 1.54% of the price. Without a homestead, as a landlord or a buyer who never files, the same house owes $7,158. In Keller ISD, the district the second most residents live in, the school line is 1.0852 per $100 after the same $140,000, and the same house comes to $5,149, 1.57%. On $295,800, Zillow's August 2026 value for a typical Fort Worth home, the Fort Worth ISD stack comes to $4,425, 1.50%, lower because the school district's flat exemption is a larger share of a cheaper house. These are the 2025 rates, the bills due by 31 January 2026. The City has since adopted 0.70565 for 2026, but when these figures were retrieved the Tarrant County Tax Assessor-Collector's table and the appraisal district's still ran to 2025, so the calculators stay on 2025 until all six units' 2026 rates are published.
How safe each city is, by the numbers it publishes
Police-reported figures for the most recent year each force or statistics agency has released. Rates describe a whole city or metro area, and the spread between neighbourhoods inside one city is usually wider than the gap between the two cities.
| Measure | Ottawa | Fort Worth | Advantage |
|---|---|---|---|
| Crime Severity Index Statistics Canada's weighted index for the metropolitan area, where 100 is Canada in 2006. American cities have no equivalent series. | 50.6 (2025) | Not published | Not directly comparable |
| Violent crime per 100,000 Canada counts every violent Criminal Code incident; the FBI counts four offences. The Canadian figure is always the larger one for that reason alone. | 814 (2025) | 375 (2025) | Not directly comparable |
| Property crime per 100,000 | 2,835 (2025) | 2,226 (2025) | Not directly comparable |
| Homicides Counts, not rates, and a single year in a small city moves a long way on chance alone. What each figure covers is under the table. | 21 (2025) | 78 (2025) | Not directly comparable |
The Ontario-part CSI rose from 46.85 in 2021 to 54.20 in 2023, held at 54.12 in 2024 and fell 6% to 50.61 in 2025 (table 35-10-0026-01). The violent crime rate has kept climbing, from 744 per 100k in 2021 to 814 in 2025, while property crime peaked in 2024 at 2,957 per 100k and eased to 2,835 in 2025.
What the rates cover: Total violent Criminal Code violations, rate per 100,000, Ottawa-Gatineau CMA Ontario part, table 35-10-0177-01 (10,745 incidents).
Homicides: Ottawa-Gatineau CMA Ontario part, table 35-10-0177-01; rate 1.59 per 100,000. 2024 was 27 (2.10 per 100k), the highest of the last five years.
On the FBI's definitions, violent offenses in Fort Worth went from 5,428 in 2021 to 4,876 in 2022, 4,849 in 2023, 4,641 in 2024 and 3,859 in 2025, a 17% drop in the last year and 29% in four, and property offenses from 25,186 to 26,275, 26,098 and a peak of 27,290 in 2024, then 22,886, 16% below it. Motor vehicle theft rose from 3,687 in 2021 to 5,157 in 2024 and fell to 3,616 in 2025, down 30%. In 2025 the CDE shows aggravated assaults down 18% (3,230 to 2,656), rapes down 18% (613 to 505), robberies down 15% (726 to 620), burglaries down 16% and larcenies down 12%, while murders rose 8% (72 to 78), the one violent measure that went up. Eddie Garcia, Dallas's former police chief, took over the department in September 2025 after months without a permanent chief, and FWPD's own figures for January through August 2026 against the same months of 2025 show robberies down from 436 to 269 and aggravated assaults from 1,842 to 1,557 as well as the drop in murders (WFAA). The 2025 CDE counts were read on 30 September 2026 from a feed last refreshed on 15 September and can still be revised.
What the rates cover: Computed: 3,859 violent offenses (murder, rape, robbery and aggravated assault) in the FBI Crime Data Explorer's summarized data for the Fort Worth Police Department (ORI TX2201200) in calendar 2025, divided by the 1,028,117 Vintage 2025 city population. On the CDE's own agency population of 1,030,410 the rate is also 375. That is the lowest of the Texas cities this site compares, against 532 in San Antonio, 577 in Dallas and 890 in Houston. No FWPD total on this definition was found in anything fetched; the city's quarterly crime reports, as the Fort Worth Star-Telegram described them, count crimes against persons, a broader group that includes assaults and sex offenses, and put them 12% lower in the first half of 2025 than a year earlier.
Homicides: 78 murders and nonnegligent manslaughters in 2025 in the FBI CDE, against 72 in 2024, about 7.6 per 100,000 on the city population. Spectrum News, reading city data in February 2026, also put the year's homicides 8% above 2024. Most of the rise came early: the city's quarterly reports counted 20 homicides in January through March 2025 against 9 a year earlier and 43 in the first half against 31 (Fort Worth Star-Telegram). The CDE series has fallen from 118 in 2021, and 2026 has turned the other way: FWPD counted 36 murders through 31 August against 54 in the same months of 2025 (WFAA).
Winters, summers and what the weather can do to a house
| Measure | Ottawa | Fort Worth | Advantage |
|---|---|---|---|
| January mean | -10.0 °C | 7.7 °C | Not directly comparable |
| July mean | 21.2 °C | 29.5 °C | Not directly comparable |
| Precipitation a year | 930 mm | 898 mm | Not directly comparable |
| Snowfall a year | 232 cm | 4 cm | Not directly comparable |
| Sunshine a year | 2,084 hours | 2,850 hours | Fort Worth |
Environment and Climate Change Canada 1991-2020 normals at Ottawa Macdonald-Cartier Int'l A (climate ID 6106000). Annual mean 6.5 C, rainfall 757.2 mm. Sunshine hours are from the 1981-2010 normals at Ottawa CDA (climate ID 6105976) because the 1991-2020 airport table does not publish sunshine totals.
Hazards: Cold winters with regular snowstorms and freezing rain, spring flooding along the Ottawa River (2017 and 2019), summer heat and humidity, occasional severe thunderstorms and tornadoes (September 2018, the May 2022 derecho), and wildfire smoke episodes such as June 2023.
NOAA NCEI 1991-2020 normals for Fort Worth Meacham International Airport (station USW00013961), the city-owned general aviation field inside the city about 5 miles north-northwest of downtown: January mean 45.8F, July mean 85.1F, annual mean 65.9F, 35.34 in of precipitation. Meacham's normals carry no snowfall, so the 1.6 in of snow stored here is the normal at Dallas Fort Worth International Airport (USW00003927), about 20 miles northeast of downtown, where the National Weather Service keeps the metro's official record. August is the warmest month by a tenth of a degree at 85.2F, with a mean high of 95.9F; July's mean high is 95.7F and January's mean low is 35.3F. October (4.46 in) is the wettest month, then May and June (4.02 in each), and January (2.05 in) the driest. The normals count 105.5 days a year at 90F or above, 24.1 at 100F or above and 32.8 nights at or below freezing. DFW Airport averages 46.3F in January and 85.7F in July with 37.01 in of rain, 20.3 days at 100F or above and 29.2 nights at or below freezing. Converted here to 7.7 C, 29.5 C, 898 mm and 4.1 cm. Those 24.1 days at 100F are more than Love Field's 22.4 for Dallas and fewer only than Austin's 28.7 among the Texas cities this site compares, although the July mean is 1.2 C below Dallas's. Sunshine hours are the older 1961-1990 NCDC means that Current Results lists for Dallas (2,850 hours, 61% of possible, and 135 clear days); it lists no separate Fort Worth figure, and the 1991-2020 normals do not include sunshine.
Hazards: Hail is the costly routine hazard. On the evening of 5 May 1995 a supercell dropped hail up to softball size on Mayfest, the outdoor festival on the bank of the Trinity River, where more than 10,000 people were caught in the open: more than 400 were hurt and 60 seriously enough to be hospitalized, though no one died at the festival. The storms went on to kill one driver in a swollen creek in western Tarrant County and 19 people in Dallas County, most of them in floodwater, and the National Weather Service puts the damage at about $2 billion, one of the costliest hailstorms in history. Cotality counted more than 235,000 Texas homes hit by damaging hail in 2025, far more than in any other state, with the risk concentrated in Dallas-Fort Worth and the other Texas Triangle metros. Tornadoes have hit the center of the city. At 6:18 pm on 28 March 2000 a tornado touched down near Castleberry High School, about 4 miles west of downtown, and tracked east along West 7th Street, nearly destroying the Cash America building and heavily damaging Mallick Tower before it weakened over downtown, where debris broke 80% of the windows in the Bank One building and 1,300 of the 5,000 in the Union Pacific Resources building. Two people died and about 80 were injured, 6 of them hospitalized; the Texas Tech damage survey rated it F2. A second tornado later that evening did F3 damage in Arlington and Grand Prairie without a death, and NOAA counts the storms of 28 and 29 March across the South at $690 million ($1.27 billion in 2024 dollars). Flooding shaped the city's form. In May 1949 a night of 6 to 12 in of rain overflowed the Trinity, killing 10 people and leaving more than 13,000 homeless, and the Army Corps of Engineers later built the 27 miles of levees of the Fort Worth Floodway, which the Tarrant Regional Water District maintains. The Corps' $1.16 billion Central City project, known locally as Panther Island, is to carry the river around downtown through new bypass channels and protect more than 2,400 acres; work on the northern half of the channel is due to begin late in 2026 and the project to be finished in 2032. Flash floods on the creeks are the more frequent danger: on 21 and 22 August 2022, 9.56 in (243 mm) fell at Meacham over the two days, 5.11 in (130 mm) of it on the 22nd, and the National Weather Service measured 8.41 in in Fort Worth, with flooding reported from Como and the John T. White neighborhood to West 7th Street; the city's 2016 floodplain plan counted more than $1 billion of stormwater improvements needed. Heat is the constant. The normals give Meacham 24.1 days a year at or above 100F (37.8 C). The summer of 2026 has been among its hottest: 55 days at 100F or above through 27 September, fourth in its record after 72 in 2011, 64 in 2023 and 62 in 1998, and 31 in a row from 3 August to 2 September, the longest run it has recorded; its highest reading is 112F (44.4 C), on 12 July 1998 and 4 September 2000. At DFW Airport the National Weather Service counts 52 days of 100F in 2026 through 22 September, tied for fifth, against the record of 71 in 2011. Cold is rare and badly handled. Winter Storm Uri took Meacham to -2F (-18.9 C) on 16 February 2021, tying 31 January 1949 for the lowest in its record, and DFW Airport also fell to -2F, the lowest there since 1953, with 5.0 in (12.7 cm) of snow over the storm. ERCOT cut power across the state grid from 15 to 18 February and about 4.5 million customers lost it at the worst; Texas counted 246 deaths from the storm, 11 of them in Tarrant County. In January 2026 Winter Storm Fern brought 2.4 in (6.1 cm) of snow and sleet to DFW Airport and a low of 11F (-11.7 C) at Meacham on the 25th.
What people earn and what the government takes
| Measure | Ottawa | Fort Worth | Advantage |
|---|---|---|---|
| Median household income | $102,000 CAD (2020) | $82,503 USD (2024) | Not directly comparable |
| Unemployment rate Statistics Canada and the Bureau of Labor Statistics define unemployment slightly differently; the Canadian measure runs about a point higher on the same labour market. | 6.8% (July 2026) | 4.6% (July 2026) | Not directly comparable |
| Sales tax | 13% | 8.25% | Fort Worth |
| Top marginal income tax Federal plus provincial or state. The American figure leaves out payroll taxes and the cost of health insurance, both of which a Canadian household covers through the tax it pays here. | 53.53% | 37% | Fort Worth |
| Income tax on $100,000, single filer Computed from each jurisdiction's brackets at a single filer's $100,000 and rounded to the dollar, so a gap of a dollar is rounding rather than tax. Two cities in one province or state are shown as Even, because there the two cells describe the same tax and whatever separates them is method. | $21,930 CAD | $13,449 USD | Not directly comparable |
The federal government is the anchor employer: 130,628 of 279,707 federal public servants were based in the National Capital Region at March 31, 2025, and Budget 2025 announced about 28,000 more public service job cuts by 2029. Regional unemployment ran from 6.4% in mid 2025 to 7.3% in late 2025 before easing to 6.8% in July 2026.
Main sectors: Federal public administration, Technology (Kanata North, Shopify, telecom and defence), Health care and hospitals, Post-secondary education, Tourism and national institutions.
Property tax is set by the City of Ottawa; not verified here.
BLS counted 1,222,100 nonfarm jobs in the Fort Worth-Arlington-Grapevine Metropolitan Division in August 2026 (not seasonally adjusted, preliminary), up 17,800 or 1.5% on the year. Professional and business services grew fastest (+5.0%, to 159,300), then mining, logging and construction (+4.8%, to 92,100), leisure and hospitality (+4.4%, to 145,500) and transportation and warehousing (+2.1%, to 102,600), while financial activities (-2.0%), information (-1.8%) and government (-0.6%, to 136,000) shrank; federal employment fell 9.0%, from 16,700 to 15,200. Manufacturing held at 110,000, of which aerospace product and parts manufacturing was 23,600, up 1.3%. The seasonally adjusted series (SMS48231040000000001) was 1,223,400 in August 2026, 1.5% above August 2025. The Texas Comptroller credits Lockheed Martin with about 49,000 direct and indirect workers in Fort Worth and a $9 billion regional impact, and 25,579 direct employees across Texas, and counts 4,553 direct and 21,266 total jobs and $2.75 billion of state GDP for Naval Air Station Joint Reserve Base Fort Worth in 2025. Hillwood's annual report puts AllianceTexas's economic impact at $12.9 billion in 2025 and $142.9 billion since it opened in 1989, and Hillwood says the Comptroller has recognized it as the primary inland port for the southwestern United States. American Airlines, with 103,440 staff in 2024, and BNSF Railway, with about 36,000, are both headquartered in the city (Wikipedia).
Main sectors: Aerospace and defense (Lockheed Martin Aeronautics, which builds the F-35 at Air Force Plant 4; Bell Textron, headquartered in the city; Naval Air Station Joint Reserve Base Fort Worth, the former Carswell Air Force Base), Airlines and freight rail (American Airlines, headquartered in the city, with its largest hub at DFW Airport; BNSF Railway, headquartered in the city), Logistics and advanced manufacturing at AllianceTexas in far north Fort Worth, which Hillwood says holds 602 companies and 73,134 jobs, Trade, transportation and utilities, the division's largest sector by payroll jobs (289,300 in August 2026), Health care and education (JPS Health Network, Cook Children's Medical Center, Texas Christian University and its medical school).
Property tax is the local levy that matters. Tax Foundation puts Texas's effective property tax rate on owner-occupied homes at 1.40%, and school districts must exempt $140,000 of a homestead's value from their tax. On 15 September 2026 the City Council adopted a $3.33 billion operating budget for fiscal 2027 unanimously and raised the city's rate by 3.565 cents to 70.565 cents per $100 of taxable value on a 7 to 4 vote, to help close a $94 million shortfall. The city says the average homeowner's bill will still fall, by $8.19 to $1,643.64 on a home valued at $232,925, because the Tarrant Appraisal District has not reappraised residential property since 2024 and the average value dropped; the city's total taxable value rose only 0.89%, to $130.2 billion (Fort Worth Report, Community Impact, CBS Texas). The budget also raises stormwater, water, sewer, solid waste and environmental fees by about $7 a month for the average resident. The county, school district, JPS hospital district, Tarrant County College and other levies on the same bill belong to the housing layer.
Whether you need a car
| Measure | Ottawa | Fort Worth | Advantage |
|---|---|---|---|
| System | OC Transpo (buses, O-Train Lines 1, 2 and 4, Para Transpo); STO serves Gatineau | Trinity Metro buses (147 fixed-route and 76 demand-response vehicles), the 27.2-mile TEXRail commuter line with 9 stations from T&P Station downtown through North Richland Hills and Grapevine to DFW Airport Terminal B (opened January 2019), the Trinity Railway Express to Dallas run with DART, ZIPZONE on-demand zones and the downtown Blue Line circulator; Fort Worth is the only full member, with Forest Hill, Grapevine, North Richland Hills and River Oaks partial members | Not directly comparable |
| Commute by public transit | 11.2% (2021) | 0.7% (2024) | Ottawa |
| Walk or cycle to work | 8.5% (2021) | 1.1% (2024) | Ottawa |
| Airport | Ottawa Macdonald-Cartier International Airport, YOW, 4.9 million passengers in 2025, up 6% on 2024 (Ottawa International Airport Authority, 2025 results) | Dallas Fort Worth International Airport (DFW), about 20 miles northeast of downtown Fort Worth and midway between the two cities, handled 85,660,127 passengers in 2025, 2.5% fewer than 2024's 87,817,864, per the airport's December 2025 traffic report; American Airlines, headquartered in Fort Worth, carried 82.6% of them, and TEXRail runs from downtown to Terminal B. Fort Worth Meacham International Airport, owned by the city about 5 miles north-northwest of downtown, has no scheduled airline service and serves general aviation; its 1933 American Airways hangar is on the National Register of Historic Places (Wikipedia). | Not directly comparable |
70.6 million O-Train and bus trips in 2025, up 3.9% on 2024 (OC Transpo report to Transit Committee, February 12, 2026). Ridership fell in early 2026: 11.5 million trips in January-February versus 12.4 million a year earlier.
Trinity Metro carried 6,180,600 unlinked trips in 2025, 4,554,400 of them by bus and 906,800 on TEXRail, and about 22,100 a weekday in the second quarter of 2026, 2,800 of them on TEXRail (APTA ridership reports, as cited by Wikipedia; APTA's PDFs refused the fetcher), against 30.7 million for VIA in San Antonio, 52.8 million for DART and 78.0 million for Houston's METRO. The Trinity Railway Express, which Trinity Metro runs with DART between downtown Fort Worth and downtown Dallas, carried 1,337,600 trips in 2025 (APTA, same source). The system is paid for by a half-cent sales tax Fort Worth has levied since 1984, half what DART's and METRO's cities pay. TEXRail runs every 30 minutes until 7 pm and hourly after, and a 2.1-mile extension to the Medical District on the Near Southside, estimated at about $167 million, is due to break ground by the end of 2026 and open in 2029 (Wikipedia).
Health care, schools and what each city is like
Health care
Care is publicly funded through OHIP after a residency waiting period for newcomers, with prescription drugs, dental and vision outside the public plan for most working-age adults. The main hospitals are The Ottawa Hospital (Civic and General campuses), CHEO for children, the Queensway Carleton and Montfort; a replacement Civic campus was promised for 2028 but construction on the hospital itself had not begun as of 2026, and finding a family doctor is the hardest part of access, with the Ontario College of Family Physicians projecting 4.4 million Ontarians without one by 2026.
Education
The University of Ottawa (bilingual) and Carleton University are the large universities, with Algonquin College and La Cite for applied programs. Publicly funded schools run through four boards: the Ottawa-Carleton District School Board, the Ottawa Catholic School Board, and French-language public and Catholic boards, so French immersion and full French schooling are both widely available.
Living there
Ottawa is a government town that behaves like a mid-sized city: quiet downtown evenings, a large share of households with two stable incomes, and a weekend life built around the Rideau Canal, the Gatineau Park hills across the river and the river pathways. Winters are long and cold, with roughly 232 cm of snow in a normal year, and summers are warm and humid. The O-Train light rail has had reliability problems since it opened in 2019, and the bus network has been cut back, so most households still drive.
Health care
Care is paid for through employer or marketplace insurance, Medicare and Medicaid, and Texas is one of the ten states that have not expanded Medicaid under the Affordable Care Act (KFF). It had the highest uninsured rate of any state in 2024: 16.7%, or 5,152,427 of 30,799,312 people, against 8.2% nationally and 12.0% in Georgia, the next highest, on the ACS 2024 1-year estimates. The City of Fort Worth's rate was 18.9% (189,692 of 1,003,516), Tarrant County's 16.9% and the metro's 16.2%. JPS Health Network, the Tarrant County Hospital District, runs John Peter Smith Hospital, the county's public hospital, a Level I trauma center and the only psychiatric emergency site in the county; on 16 April 2026 it broke ground on a $1.5 billion replacement hospital at South Main and East Morphy streets, part of a $2.5 billion building plan backed by an $800 million bond from 2018, which will take it from 582 beds to more than 740 when it opens in 2030 (Fort Worth Report). Cook Children's Medical Center has 452 licensed beds and a Level II pediatric trauma center (Wikipedia). TCU's Anne Burnett Marion School of Medicine took its first class in 2019. This file did not verify a wait time figure for primary or specialist care.
Education
Fort Worth is served by Fort Worth ISD and, in parts, by fourteen other districts, among them Keller, Northwest, Eagle Mountain-Saginaw, Crowley and Arlington (the 2020 Census school district map, as cited by Wikipedia). Fort Worth ISD is now under state control: after a campus received a fifth straight failing rating, Education Commissioner Mike Morath decided in October 2025 to intervene, and on 24 March 2026 he replaced the elected trustees' authority with a nine-member board of managers led by Pete Geren and named Peter Licata, formerly of Broward County, superintendent. It is the second-largest takeover in Texas history, after Houston ISD's. The board opened by saying roughly 63% of students do not read at grade level and 29% are proficient in math (Fort Worth Report). The district, built for 90,000 students, had 67,315 in 2025-26 on Texas Education Agency data and projected about 66,500 for 2026-27; it has lost more than 12,000 in five years and in May 2025 approved closing 18 campuses by June 2029 (CBS Texas). Texas Christian University (12,980 students in fall 2025) is about 4 miles from downtown, and the city also holds Texas Wesleyan University, UNT Health Fort Worth and Texas A&M University's law school and downtown campus.
Living there
Fort Worth has grown faster than any other US city of a million people: 11.9% since 2020, and 19,512 residents in 2024-25, a gain second only to Charlotte's; it passed a million in 2024. It is the western half of the Dallas-Fort Worth metro and works differently from Dallas: its economy leans on aircraft, airlines and freight, from the F-35 line at Lockheed Martin's plant and Bell's helicopters to the headquarters of American Airlines and BNSF and the warehouses and factories of AllianceTexas, and household income, at $82,503, is higher than in Dallas, Houston or San Antonio. It is built for the car: 74.9% of workers drive alone and 0.7% take transit, the lowest share of any city this site compares, though TEXRail runs to DFW Airport. Violent crime, at 375 per 100,000 on the FBI's counts, is the lowest of the Texas cities here. Summer is long and hot, with 24 days a year at 100F or above and 31 in a row in 2026, and hail and tornadoes are the costly weather. Texas takes no income tax, and 18.9% of residents have no health insurance. The open questions are the costs of growth: the council raised its property tax rate in September 2026 to cover a $94 million gap as appraisals stalled, the state took over the shrinking Fort Worth ISD in March 2026, and the Panther Island flood channels around downtown are not due until 2032.
Where each city wins, and where it loses
Ottawa's figures are in Canadian dollars and Fort Worth's in US dollars, and against local pay the cheaper house is nearly as dear to hold. Ottawa's composite benchmark, a blend of houses, townhouses and apartments, was $634,000 CAD in July 2026. The Fort Worth price is the North Texas Real Estate Information System's median single-family sale price for the City of Fort Worth, $327,000 USD in August 2026 on 805 sales, 0.9% below a year earlier, a city-level median of houses alone; Zillow's index for the City of Fort Worth, which models every home, stood at $295,800. The headlines are 6.2 times Ottawa's 2020 median household income of $102,000 CAD and about 4.0 times Fort Worth's 2024 median of $82,503 USD. At 20% down, Ottawa's mortgage at 4.34% is $2,762 CAD a month over 25 years, and Fort Worth's $261,600 loan at Freddie Mac's 7.03% of 24 September 2026 about $1,746 USD over 30. Property tax is 0.83% of market value in Ottawa, $5,262 CAD a year, against $5,044 USD from six taxing units on a City of Fort Worth and Fort Worth ISD address, an effective 1.54% with a homestead and $7,158 without. With insurance at $145 CAD and $350 USD a month, the owners carry about $3,350 CAD and $2,516 USD, roughly 39% and 37% of local median income. A two-bedroom averaged $1,916 CAD in October 2025 and a median one $1,317 USD in September 2026. Ontario caps increases at 2.1% for 2026 in units first occupied before 15 November 2018; Texas forbids rent control.
Homicide is the one count that crosses the border intact, and it favors Ottawa by a wide margin, though Ottawa's covers the Ontario part of its metro and Fort Worth's the city of 1,028,117. The Ontario part of Ottawa-Gatineau recorded 21 homicides in 2025, 1.59 per 100,000, against 27 in 2024; Fort Worth recorded 78 in the FBI's file, about 7.6 per 100,000, against 72 in 2024, and its police department counted 36 through August 2026 against 54 in the same months of 2025. The other rates are different instruments. Statistics Canada put the Crime Severity Index for the Ontario part at 50.61 in 2025, below the national 75.0; American cities have no equivalent. Ottawa's violent rate of 813.79 per 100,000 counts every violent Criminal Code violation, common assault and uttering threats included. Fort Worth's 375 is 3,859 FBI-definition offenses of murder, rape, robbery and aggravated assault, divided by the Census estimate, because no Fort Worth Police Department total on those definitions was found; it is the lowest of the Texas cities this site compares. Property crime, 2,834.59 per 100,000 against 2,226, is defined differently too. The directions differ: Ottawa's violent rate has increased every year since 2021, from 744 per 100,000, while Fort Worth's violent offenses dropped 17% in 2025 and stood 29% below 2021. The Fort Worth counts, read on 30 September 2026, can still be revised.
The two Januaries are nearly 18 degrees apart. Ottawa's mean of -10.0 C at the airport is the coldest of the cities this site compares, and Fort Worth's is 7.7 C at Meacham, the city's own airport. July is 21.2 C in Ottawa and 29.5 C in Fort Worth, where August is a tenth of a degree warmer and the normals count 105.5 days a year at or above 90F and 24.1 at or above 37.8 C (100F); the summer of 2026 brought Meacham 55 days of 100F through 27 September, 31 of them in a row. Ottawa gets 929.8 mm of precipitation a year against 898 mm, and takes 231.9 cm of its share as snow against a 4.1 cm normal at DFW Airport. Both cities have been hit by tornadoes. Ottawa's other hazards are freezing rain, spring flooding along the Ottawa River in 2017 and 2019, the September 2018 tornadoes, the May 2022 derecho and wildfire smoke. Fort Worth's costly routine one is hail: on 5 May 1995 a storm dropped hail up to softball size on the Mayfest festival beside the Trinity River and hurt more than 400 people. A tornado tracked along West 7th Street into downtown on 28 March 2000 and killed two, and the creeks flash-flood, as in August 2022, when 243 mm fell at Meacham in two days. Cold is rare and badly handled: Winter Storm Uri took Meacham to -2F (-18.9 C) in February 2021 while ERCOT cut power across the state grid, and Tarrant County counted 11 of the state's 246 deaths. An owner's utility premium over a renter is budgeted at $155 CAD a month in Ottawa, mostly heat from October to April, and $150 USD in Fort Worth, mostly cooling plus the City's garbage and stormwater fees.
Ottawa's anchor employer is the federal public service, and Fort Worth's is the aircraft industry. Ottawa had 130,628 of 279,707 federal public servants based in the National Capital Region at 31 March 2025, and Budget 2025 announced about 28,000 more positions to go by 2029. In the Fort Worth-Arlington-Grapevine Metropolitan Division, the city's half of the Dallas-Fort Worth metro, federal government jobs fell 9.0% in the year to August 2026, from 16,700 to 15,200, but federal money reaches Fort Worth mainly through a factory and a base. Lockheed Martin builds the F-35 at Air Force Plant 4, and the Texas Comptroller credits it with about 49,000 direct and indirect workers in Fort Worth; Naval Air Station Joint Reserve Base Fort Worth counts 4,553 direct jobs. Bell Textron, American Airlines and BNSF Railway are headquartered in the city, and Hillwood says AllianceTexas holds 602 companies and 73,134 jobs. The division counted 1,222,100 nonfarm jobs in August 2026, 1.5% more than a year earlier, and its unemployment rate was 4.6% in July, not seasonally adjusted. Ottawa-Gatineau's was 6.8% the same month, seasonally adjusted and above Canada's 6.4%; the two are not directly comparable, though the gap is wide. Median household income was $102,000 CAD in Ottawa in 2020 and $82,503 USD in Fort Worth in 2024. Ontario levies a provincial income tax, so $100,000 pays about $21,930 CAD, including the $750 Ontario Health Premium and before CPP and EI, with a top combined rate of 53.53% and 13% HST. Texas levies none, so the same salary pays $13,449 USD in federal tax for 2025; the top rate is the federal 37% and sales tax is 8.25%. Property tax carries the load instead, 1.54% on the Fort Worth median against 0.83% on Ottawa's benchmark.
Transit is Ottawa's by a wide margin. In the 2021 census 11.2% of Ottawa commuters took transit and 8.5% walked or cycled, counted in May 2021 with remote work at its height, so the share now is unknown rather than low. In Fort Worth in 2024, 0.7% took transit, the lowest share of any city this site compares, 1.1% walked or cycled, 74.9% drove alone and 10.5% worked from home. OC Transpo carried 70.6 million trips in 2025 on buses and O-Train Lines 1, 2 and 4, though the O-Train has had reliability problems since it opened in 2019 and January and February 2026 slipped to 11.5 million trips from 12.4 million a year earlier. Trinity Metro carried 6,180,600, 906,800 of them on TEXRail, a 27.2-mile commuter line from downtown to DFW Airport's Terminal B that runs every 30 minutes until 7 pm and hourly after, and the Trinity Railway Express to Dallas carried 1,337,600 more; a 2.1-mile TEXRail extension to the Medical District is due to open in 2029. Flying favors Fort Worth by a wide margin, though the airport is not its alone: DFW, about 20 miles northeast of downtown and midway between Fort Worth and Dallas, handled 85,660,127 passengers in 2025, 2.5% fewer than in 2024 and 82.6% of them on American Airlines, against 4.9 million at Ottawa, from which many trips connect through Toronto or Montreal.
Health care is where the border shows most. In Ottawa, OHIP pays for physician and hospital care with nothing due at the point of use after a residency wait for newcomers, though prescriptions, dental and vision mostly fall outside it. The bottleneck is a family doctor: the Ontario College of Family Physicians projected 4.4 million Ontarians without one by 2026, and the replacement Civic campus, promised for 2028, had not begun construction. In Fort Worth care is bought through an employer or marketplace plan, Medicare or Medicaid, and Texas is one of ten states that have not expanded Medicaid. It had the highest uninsured rate of any state in 2024, 16.7%, and the City of Fort Worth's was 18.9%. JPS Health Network, the county's hospital district, runs John Peter Smith Hospital, a Level I trauma center, and broke ground in April 2026 on a $1.5 billion replacement that is to take it from 582 beds to more than 740 in 2030, so both cities are waiting on a new hospital; Cook Children's Medical Center has 452 licensed beds. This site verified no wait time for either city. Ottawa has four publicly funded school boards, English and French, public and Catholic, so French immersion and full French schooling are ordinary choices. Fort Worth ISD, where about half the city's residents live, has been run by a state-appointed board of managers since 24 March 2026, after a campus's fifth straight failing rating; built for 90,000 students, it had 67,315 in 2025-26 and is closing 18 campuses by June 2029, and fourteen other districts serve the rest of the city.
What people underestimate is that the near tie rests on figures with dates on them. The rate is one. Ottawa's 4.34% is fixed for a five-year term and then renews at whatever the rate is then, while the Fort Worth 7.03% holds for thirty years; at 6.67%, the August rate Charlotte and the Florida cities on this site were written at, the Fort Worth carry would be about $2,453. The tax is the other. Ottawa levies about 1.26% against assessments frozen at 1 January 2016, which is why the bill works out to 0.83% of what a buyer pays today, and none of this site's sources dates the next reassessment. The Fort Worth $5,044 is the 2025 tax year across six units, and on 15 September 2026 the City Council voted 7 to 4 to raise the city's own rate from 0.67 to 0.70565 per $100, to close a $94 million shortfall, though the City says the average bill will still fall because the appraisal district has not reappraised houses since 2024. It assumes a filed homestead, after which the appraised value can rise no more than 10% a year, and holds only inside the City and Fort Worth ISD: one of the six units, the Tarrant Regional Water District, takes no homestead exemption at all, the same house in Keller ISD pays $5,149, and a newer house on the northern or western edge often sits in a public improvement district with an assessment of its own. The flood cover is left out too, because a homeowners policy does not pay for rising water, and the City counts 2,351 gas wells inside its limits, where the mineral rights under a lot are often not the seller's. Getting in differs as well: an Ottawa buyer owes $9,155 CAD in Ontario land transfer tax on the benchmark, and a Texas buyer owes none.
Better here
- There were 21 homicides in 2025 across the Ontario part of the metro, 1.59 per 100,000, against 78 in Fort Worth at about 7.6.
- OHIP covers physician and hospital care whoever employs you, where 18.9% of Fort Worth residents had no health insurance in 2024.
- Transit carried 11.2% of commuters in the 2021 census and 8.5% walked or cycled, against 0.7% and 1.1% in Fort Worth in 2024, the lowest transit share of any city this site compares.
- Property tax works out to 0.83% of market value for 2026, $5,262 CAD a year on the benchmark, against an effective 1.54% on the Fort Worth median for the 2025 tax year.
- July averages 21.2 C on the 1991-2020 normals, against 29.5 C at Fort Worth Meacham, where the same normals count 105.5 days a year at or above 90F.
- Four publicly funded school boards, English and French, public and Catholic, make French schooling an ordinary choice.
Worse here
- Regional unemployment was 6.8% in July 2026 against 4.6% in the Fort Worth-Arlington-Grapevine division on an unadjusted basis, and Budget 2025 announced about 28,000 more federal public service cuts by 2029.
- January averages -10.0 C on a 231.9 cm snow normal, the coldest January mean of the cities this site compares, against 7.7 C and 4.1 cm around Fort Worth.
- Income tax on $100,000 is about $21,930 CAD for 2025 against $13,449 USD of federal tax in Fort Worth, sales tax is 13% HST against 8.25%, and the top combined rate is 53.53% against 37%.
- A buyer owes $9,155 in Ontario land transfer tax on the July 2026 benchmark, where Texas has no transfer tax.
- 4.4 million Ontarians were projected to be without a family doctor by 2026, and the replacement Civic campus promised for 2028 had not begun construction.
- Ottawa's airport handled 4.9 million passengers in 2025, against 85,660,127 at DFW, American Airlines' largest hub.
Choose Ottawa if
- you want health coverage that comes with residency and survives a layoff
- you would take a -10.0 C January over a summer with 105 days a year at 90F or more
- you are raising children and want French schooling to be an ordinary option
- you want to get to work by train or bus rather than by car
The Ottawa guide · Neighbourhoods · Ottawa rent vs buy · Ottawa mortgage calculator
Better here
- Unemployment in the Fort Worth-Arlington-Grapevine division was 4.6% in July 2026, not seasonally adjusted, against 6.8% in Ottawa-Gatineau, on 1,222,100 nonfarm jobs in August.
- Texas levies no income tax, so $100,000 pays $13,449 USD in federal tax for 2025 and $13,170 for 2026, against about $21,930 CAD in Ottawa.
- January averages 7.7 C with a 4.1 cm snow normal, against -10.0 C and 231.9 cm in Ottawa.
- The median single-family sale price of $327,000 USD is about 4.0 times the city's median household income, against 6.2 times for Ottawa's benchmark, and the buyer pays no transfer tax.
- DFW handled 85,660,127 passengers in 2025, American Airlines' largest hub, and TEXRail runs to it from downtown.
- Violent offenses on the FBI's definitions dropped 17% in 2025 to 3,859, the lowest rate of the Texas cities this site compares, while Ottawa's police-reported violent rate has increased every year since 2021.
Worse here
- There were 78 homicides in 2025, about 7.6 per 100,000, against 21 and 1.59 in the Ontario part of the Ottawa metro.
- Mortgage, property tax and insurance come to about $2,516 USD a month on the August 2026 single-family median, roughly 37% of the city's 2024 median household income against 39% in Ottawa, before any flood policy.
- Property tax on the median is $5,044 a year for the 2025 tax year with a homestead, an effective 1.54%, and $7,158 without one, and the City Council voted in September 2026 to raise the city's rate.
- Texas had the highest uninsured rate of any state in 2024, 16.7%, the City of Fort Worth's was 18.9%, and Texas is one of ten states that have not expanded Medicaid.
- Hail is the costly routine hazard, the reason insurance is budgeted at $350 a month against $145 CAD in Ottawa, and the normals count 24.1 days a year at or above 37.8 C (100F).
- Only 0.7% of workers commuted by transit in 2024 and 74.9% drove alone, and Trinity Metro carried 6,180,600 trips in 2025 against OC Transpo's 70.6 million.
Choose Fort Worth if
- you work in aircraft, airlines or freight rather than in a public service facing cuts
- you want a 7.7 C January instead of -10.0 C and can plan a summer around 24 days a year at 100F or more
- you fly often enough that American Airlines' largest hub changes how you travel
- you have employer health insurance you trust and would rather pay property tax on a house than provincial income tax on a salary
The Fort Worth guide · Neighborhoods · Fort Worth rent vs buy · Fort Worth mortgage calculator
Ottawa or Fort Worth, in short
Is Ottawa or Fort Worth cheaper to live in?
Neither by much to own, once each bill is held against its own city's pay, because the currencies do not convert here. The Fort Worth house is the lower multiple of income: the North Texas Real Estate Information System's $327,000 USD median single-family sale price for the city is about 4.0 times the City of Fort Worth's 2024 median household income of $82,503 USD, and Ottawa's $634,000 CAD composite benchmark 6.2 times the city's 2020 median of $102,000 CAD. But an Ottawa owner pays about $3,350 CAD a month on mortgage, property tax and insurance, roughly 39% of that income, and a Fort Worth owner about $2,516 USD, roughly 37%, because the mortgage rate is 7.03% against 4.34%, the property tax 1.54% against 0.83% and the insurance $350 USD a month against $145 CAD. Zillow's index for the City of Fort Worth stood lower than the median, at $295,800. Renting favors Fort Worth: a two-bedroom averaged $1,916 CAD in October 2025 in Ottawa and a median one was $1,317 USD in Fort Worth in September 2026, about 23% and 19% of each city's median household income. Fort Worth takes less income tax, $13,449 USD on $100,000 for 2025 against about $21,930 CAD, and less sales tax, 8.25% against 13%, and an Ottawa buyer funds $9,155 CAD of land transfer tax at closing.
Is Ottawa or Fort Worth safer?
Ottawa on homicide, the one count that crosses the border, though it is a count for the Ontario part of the metro against one for the City of Fort Worth. Ottawa's recorded 21 homicides in 2025, 1.59 per 100,000, against 27 in 2024; Fort Worth recorded 78 in the FBI's file, about 7.6 per 100,000, against 72 in 2024, though its police counted 36 through August 2026 against 54 a year earlier. The other rates are different instruments. Ottawa's violent rate of 813.79 per 100,000 counts every violent Criminal Code violation, including common assault, while Fort Worth's 375 is murder, rape, robbery and aggravated assault from the FBI's counts, divided by the Census estimate and still open to revision. Property crime, 2,834.59 per 100,000 against 2,226, is defined differently as well. Statistics Canada put Ottawa's Crime Severity Index at 50.61 in 2025 against a national 75.0; American cities have no equivalent. Ottawa's violent rate has increased every year since 2021; Fort Worth's violent offenses dropped 17% in 2025.
Which has the better climate, Ottawa or Fort Worth?
Fort Worth in winter and Ottawa in summer, and the winters are nearly 18 degrees apart. January averages 7.7 C in Fort Worth with a 4.1 cm snow normal, against -10.0 C and 231.9 cm in Ottawa, the coldest January mean of the cities this site compares, and an Ottawa owner heats from October to April. July averages 21.2 C in Ottawa against 29.5 C at Fort Worth Meacham, where the normals count 105.5 days a year at or above 90F and 24.1 at or above 37.8 C (100F), and the summer of 2026 brought 31 days of 100F in a row. The two get similar precipitation, 929.8 mm against 898 mm. Both have been hit by tornadoes, Ottawa in September 2018 and downtown Fort Worth in March 2000. Ottawa's other hazards are freezing rain, Ottawa River flooding as in 2017 and 2019, the May 2022 derecho and wildfire smoke; Fort Worth's are hail, creek flash floods, long runs of 100F heat and the rare hard freeze, like February 2021, when ERCOT cut power across the state grid.
What happens to my health care if I move from Ottawa to Fort Worth?
Coverage stops coming with residency and starts coming with a job or a purchase. In Ottawa, OHIP pays for physician and hospital care with nothing due at the point of use after a residency wait for newcomers, and an employer plan matters for prescriptions, dental and vision; the problem is access, with 4.4 million Ontarians projected to be without a family doctor by 2026. In Fort Worth you need an employer or marketplace plan, Medicare or Medicaid, with the premium, deductible and copay that come with it. Texas is one of the ten states that have not expanded Medicaid and had the highest uninsured rate of any state in 2024, 16.7%; the City of Fort Worth's was 18.9%. JPS Health Network's John Peter Smith Hospital is Tarrant County's public hospital and a Level I trauma center, with a $1.5 billion replacement due in 2030, and Cook Children's Medical Center has 452 licensed beds. This site verified no wait time figure for either city.
Where the figures come from
Housing figures are the ones behind each city's calculators, dated on those pages. The rest are listed here with the date they were retrieved. See the methodology for how facts, estimates and opinion are kept apart.
- Census Profile, 2021 Census of Population: Ottawa, City (CSD) and Ottawa-Gatineau (Ontario part) · Statistics Canada · retrieved Supports: population.city (2021 count), Five-year growth, Median household income, Transit commute share, Walk and cycle commute share
- Census Profile, 2021 Census of Population: Ottawa-Gatineau (CMA) · Statistics Canada · retrieved Supports: population.metro (2021 count), population.growthPct5y (CMA)
- Population estimates, July 1, by census subdivision, 2021 boundaries (table 17-10-0155-01) · Statistics Canada · retrieved Supports: City population
- Population estimates, July 1, by census metropolitan area and census agglomeration, 2021 boundaries (table 17-10-0148-01) · Statistics Canada · retrieved Supports: Metro population
- Crime severity index and weighted clearance rates, Canada, provinces, territories and Census Metropolitan Areas (table 35-10-0026-01) · Statistics Canada · retrieved Supports: Crime Severity Index, Crime trend
- Police-reported Crime Severity Index and crime rate, by census metropolitan area, 2025 · Statistics Canada, The Daily · retrieved Supports: Crime Severity Index, crime.propertyRatePer100k (all-crime rate context)
- Incident-based crime statistics, by detailed violations, Canada, provinces, territories, CMAs (table 35-10-0177-01) · Statistics Canada · retrieved Supports: Violent crime rate, Property crime rate, Homicides, Crime trend
- Ottawa crime rate increases in 2025, remains above Ontario average · Yahoo News Canada (Ottawa Police Service KPI report to the Police Services Board, January 26, 2026) · retrieved Supports: crime.index (OPS city CSI 55.8)
- Canadian Climate Normals 1991-2020, Ottawa Macdonald-Cartier Int'l A · Environment and Climate Change Canada · retrieved Supports: January mean, July mean, Annual precipitation, Annual snowfall
- Canadian Climate Normals 1981-2010, Ottawa CDA · Environment and Climate Change Canada · retrieved Supports: Sunshine hours
- Labour force characteristics by census metropolitan area, three-month moving average, seasonally adjusted (table 14-10-0459-01) · Statistics Canada · retrieved Supports: Unemployment rate, Labour market
- Labour Force Survey, July 2026 · Statistics Canada, The Daily · retrieved Supports: economy.unemploymentPct (Canada and Ontario comparison)
- Federal government to cut another 28,000 public service jobs by 2029 · CTV News Ottawa · retrieved Supports: Labour market
- Federal Government Jobs in Ottawa: 2026 Hiring Guide (citing Public Service Commission counts at March 31, 2025) · Via Ottawa · retrieved Supports: economy.note (NCR public servant count)
- 2025 and 2026 Combined Federal and Ontario Tax Rates Including Surtaxes · TaxTips.ca · retrieved Supports: Top marginal income tax, Income tax on $100,000
- Ontario Health Premium · TaxTips.ca · retrieved Supports: Income tax on $100,000
- 2025 Non-Refundable Personal Tax Credits, Base Amounts · TaxTips.ca · retrieved Supports: Income tax on $100,000
- Recap: February 12, 2026 Transit Committee · OC Transpo · retrieved Supports: Transit ridership
- OC Transpo sees drop in ridership to start 2026 · CTV News Ottawa · retrieved Supports: transit.ridershipNote (early 2026)
- A transformational year: Ottawa Airport Authority reports 2025 results · Ottawa International Airport Authority · retrieved Supports: Airport passengers
- More Than Four Million Ontarians Will Be Without a Family Doctor by 2026 · Ontario College of Family Physicians · retrieved Supports: Health care
- New Ottawa Civic hospital opening likely delayed by years, says project consultant · CBC News · retrieved Supports: Health care
- Annual Estimates of the Resident Population for Incorporated Places in Texas: April 1, 2020 to July 1, 2025 (SUB-EST2025) · US Census Bureau · retrieved Supports: City population, Five-year growth, Violent crime rate, Property crime rate, Homicides, Character
- Annual Estimates of the Resident Population for Incorporated Places of 50,000 or More (all states, SUB-EST2025) · US Census Bureau · retrieved Supports: City population, Five-year growth, Character
- Annual Resident Population Estimates and Components of Change for Metropolitan and Micropolitan Statistical Areas and Their Counties: April 1, 2020 to July 1, 2025 (CBSA-EST2025-ALLDATA) · US Census Bureau · retrieved Supports: Metro population, Five-year growth
- Crime Data Explorer summarized agency data, Fort Worth Police Department (TX2201200): violent crime, property crime, homicide, rape, robbery, aggravated assault, burglary, larceny, motor vehicle theft and arson, 2021-2025 · FBI · retrieved Supports: Violent crime rate, Property crime rate, Homicides, Crime trend, Character
- Dallas sees drop in violent crime while Fort Worth sees increase in homicides · Spectrum News · retrieved Supports: Homicides, Crime trend
- After 'puzzling' spike in homicides, Fort Worth leaders look to new police chief · Fort Worth Star-Telegram (via Yahoo News) · retrieved Supports: Violent crime rate, Homicides
- Eddie Garcia marks one year as Fort Worth police chief, shares reasons behind city's drop in violent crime · WFAA (via Yahoo News) · retrieved Supports: Homicides, Crime trend
- US Climate Normals 1991-2020, station USW00013961 Fort Worth Meacham International Airport (Access Data Service) · NOAA National Centers for Environmental Information · retrieved Supports: January mean, July mean, Annual precipitation, Climate normals, Climate hazards, Character, January 45.8F, July 85.1F and August 85.2F from the monthly series, which carries no snowfall normal for this station, and annual mean 65.9F, precipitation 35.34 in and the counts of days at 90F and 100F and nights at freezing from dataset=normals-annualseasonal-1991-2020 for the same station
- US Climate Normals 1991-2020, station USW00003927 Dallas Fort Worth International Airport (Access Data Service) · NOAA National Centers for Environmental Information · retrieved Supports: Annual snowfall, Climate normals, 1.6 in of snow, January 46.3F, July 85.7F, 37.01 in of precipitation, 20.3 days at 100F and 29.2 nights at freezing, the last three from dataset=normals-annualseasonal-1991-2020
- Global Historical Climatology Network daily summaries, Fort Worth Meacham International Airport (USW00013961), 1946-1953 and 1992-2026 · NOAA National Centers for Environmental Information · retrieved Supports: Climate hazards, Character, 55 days at or above 100F in 2026 through 27 September, 72 in 2011, 64 in 2023 and 62 in 1998, 31 in a row from 3 August to 2 September 2026, 112F on 12 July 1998 and 4 September 2000, -2F on 16 February 2021 and 31 January 1949, 4.45 in on 21 August 2022 and 5.11 in on 22 August 2022, 11F on 25 January 2026
- Global Historical Climatology Network daily summaries, Dallas Fort Worth International Airport (USW00003927), 1953-2026 · NOAA National Centers for Environmental Information · retrieved Supports: Climate hazards, -2F on 16 February 2021, 5.0 in of snow on 14 and 17 February 2021, 2.4 in of snow and sleet on 24 and 25 January 2026
- Dallas/Fort Worth: Annual and Consecutive 100 Degree Days (last updated 22 September 2026) · National Weather Service, Fort Worth/Dallas · retrieved Supports: Climate hazards
- Average Annual Sunshine in US Cities · Current Results (NCDC Comparative Climatic Data, 1961-1990) · retrieved Supports: Sunshine hours, Climate normals
- Mayfest Hailstorm, May 5, 1995 · National Weather Service, Fort Worth/Dallas · retrieved Supports: Climate hazards
- Cotality 2026 Report: Hail risk now rivals major hurricanes (2026 Severe Convective Storm Risk Report) · Cotality · retrieved Supports: Climate hazards
- March 28, 2000: 10th Anniversary, a review of the March 28, 2000 tornadoes affecting Fort Worth and Arlington (from NWS Storm Data) · National Weather Service, Fort Worth/Dallas · retrieved Supports: Climate hazards
- Damage Survey and Assessment of Fort Worth Tornado, 28 March 2000 · Texas Tech University Wind Science and Engineering Research Center · retrieved Supports: Climate hazards
- 2000 Fort Worth tornado outbreak · Wikipedia · retrieved Supports: Climate hazards
- Weather and Climate Billion-Dollar Disasters to affect the U.S. from 1980-2024 (events list) · NOAA National Centers for Environmental Information · retrieved Supports: Climate hazards
- Flood Protection · Tarrant Regional Water District · retrieved Supports: Climate hazards
- Panther Island bypass project moves forward after Trinity River dams, flood storage delays · Fort Worth Report · retrieved Supports: Climate hazards, Character
- 'Boom, here we're hit with it again.' How historic rains flooded homes and neighborhoods across Tarrant County · Fort Worth Report · retrieved Supports: Climate hazards
- February 2021 Winter Storm-Related Deaths, Texas (mortality surveillance report) · Texas Department of State Health Services · retrieved Supports: Climate hazards
- The Timeline and Events of the February 2021 Texas Electric Grid Blackouts · The University of Texas at Austin Energy Institute · retrieved Supports: Climate hazards
- ACS 2024 1-year tables B08301 and B19013 for Fort Worth city, Tarrant County and the Dallas-Fort Worth-Arlington MSA · Census Reporter API (US Census Bureau ACS) · retrieved Supports: Median household income, Transit commute share, Walk and cycle commute share, Character
- ACS 2024 1-year table B27001 (health insurance coverage) for the 50 states, DC, the US, Tarrant County, Fort Worth city and the Dallas-Fort Worth-Arlington MSA · Census Reporter API (US Census Bureau ACS) · retrieved Supports: Health care, Character
- Local Area Unemployment Statistics, Fort Worth-Arlington-Grapevine, TX Metropolitan Division (LAUDV482310400000003), the Dallas-Fort Worth-Arlington MSA (LAUMT481910000000003), Fort Worth city (LAUCT482700000000003), Tarrant County (LAUCN484390000000003) and the US rate (LNU04000000), not seasonally adjusted · US Bureau of Labor Statistics · retrieved Supports: Unemployment rate
- Current Employment Statistics, Fort Worth-Arlington-Grapevine, TX Metropolitan Division: total nonfarm (SMU48231040000000001, SMS48231040000000001), supersectors (SMU4823104xx00000001) and aerospace product and parts manufacturing (SMU48231043133640001) · US Bureau of Labor Statistics · retrieved Supports: Main sectors, Labour market
- Naval Air Station Joint Reserve Base Fort Worth (Texas military installations economic impact, 2025) · Texas Comptroller of Public Accounts · retrieved Supports: Main sectors, Labour market, Character
- AllianceTexas Drives $142.9 Billion in Economic Impact for North Texas · Hillwood · retrieved Supports: Main sectors, Labour market, Character
- United States Air Force Plant 4 (Lockheed Martin Aeronautics, F-35 production) · Wikipedia · retrieved Supports: Main sectors
- American Airlines (headquarters, DFW hub, employees) · Wikipedia · retrieved Supports: Main sectors, Labour market, Airport passengers
- BNSF Railway (headquarters, employees) · Wikipedia · retrieved Supports: Main sectors, Labour market
- Bell Textron (headquarters) · Wikipedia · retrieved Supports: Main sectors
- City Sales and Use Tax (city rate table) · Texas Comptroller of Public Accounts · retrieved Supports: Sales tax
- Transit Sales and Use Tax (Fort Worth MTA, effective April 1, 1984) · Texas Comptroller of Public Accounts · retrieved Supports: Sales tax, Transit ridership
- Special Purpose District Sales and Use Tax (Fort Worth Crime Control District, effective October 1, 1995) · Texas Comptroller of Public Accounts · retrieved Supports: Sales tax
- Texas Tax Rates & Rankings · Tax Foundation · retrieved Supports: Top marginal income tax, Income tax on $100,000, Tax notes, Character
- 2025 Tax Brackets and Federal Income Tax Rates · Tax Foundation · retrieved Supports: Top marginal income tax, Income tax on $100,000
- 2026 Tax Brackets and Federal Income Tax Rates · Tax Foundation · retrieved Supports: Top marginal income tax, Income tax on $100,000
- Property Tax Exemptions · Texas Comptroller of Public Accounts · retrieved Supports: Tax notes
- Fort Worth passes $4.35B budget and property tax rate increase · Community Impact · retrieved Supports: Tax notes, Character
- Slightly lower property tax bills part of Fort Worth's $3.33B budget for 2027, leaders say · CBS Texas · retrieved Supports: Tax notes
- Fort Worth proposes property tax rate bump, cost cuts to close $94M shortfall for 2027 · Fort Worth Report · retrieved Supports: Tax notes, Character
- Trinity Metro (service area, members, services, fleet, citing the APTA Transit Ridership Reports, Q4 2025 and Q2 2026) · Wikipedia · retrieved Supports: Transit system, Transit ridership
- TEXRail (length, stations, opening, frequency, ridership, Medical District extension) · Wikipedia · retrieved Supports: Transit system, Transit ridership, Airport passengers
- Template:American transit ridership (APTA Transit Ridership Reports, Q4 2025 and Q2 2026) · Wikipedia · retrieved Supports: Transit ridership
- DFW Total Passengers, December 2025 (calendar year 2025 vs 2024) · Dallas Fort Worth International Airport · retrieved Supports: Airport passengers
- Fort Worth Meacham International Airport (ownership, general aviation, history) · Wikipedia · retrieved Supports: Airport passengers, Climate normals
- Status of State Medicaid Expansion Decisions · KFF · retrieved Supports: Health care
- A new era: JPS breaks ground on $1.5B hospital · Fort Worth Report · retrieved Supports: Health care
- JPS Health Network (Tarrant County Hospital District, John Peter Smith Hospital) · Wikipedia · retrieved Supports: Health care
- Cook Children's Medical Center · Wikipedia · retrieved Supports: Health care
- Texas Education Agency Appoints Board of Managers and Names New Superintendent to Lead Fort Worth ISD · Texas Education Agency · retrieved Supports: Education
- 'We failed our kids': New Fort Worth ISD board signals urgency as state takeover begins · Fort Worth Report · retrieved Supports: Education, Character
- As enrollment drops, FWISD to shift bilingual, special ed services closer to campuses · Fort Worth Report · retrieved Supports: Education, Character
- Fort Worth ISD board gives final approval to close 18 schools amid budget woes, enrollment decline · CBS Texas · retrieved Supports: Education
- Fort Worth, Texas (school districts serving the city, citing the 2020 Census school district reference map for Tarrant County; colleges and universities) · Wikipedia · retrieved Supports: Education
- Texas Christian University (fall 2025 enrollment, location, School of Medicine) · Wikipedia · retrieved Supports: Education, Health care
- MLS® Home Price Index: Ottawa Real Estate Board, July 2026 · Canadian Real Estate Association / Ottawa Real Estate Board · retrieved Supports: Composite MLS® HPI benchmark of $634,000 in July 2026, down 0.5% year over year, Single-family benchmark of $725,000, up 0.7% year over year, Townhouse and row benchmark of $542,500, down 5.1% year over year, Apartment benchmark of $385,500, down 5.2% year over year, 1,325 sales and 4,678 active listings in July 2026
- Rental Market Survey: Ottawa, average rent by bedroom type, October 2025 · Canada Mortgage and Housing Corporation · retrieved Supports: Ottawa average purpose-built rents of $1,332 studio, $1,593 one-bedroom, $1,916 two-bedroom and $2,090 three-bedroom-plus, An overall average of $1,743 across 89,170 purpose-built units, Year-over-year increases of 3.4% on one- and two-bedroom units and 3.9% overall, Average rent of $2,320 in buildings completed in 2000 or later against $1,529 in buildings from before 1960
- Rental Market Statistics Summary: Ottawa (CV), October 2025 · Canada Mortgage and Housing Corporation · retrieved Supports: City of Ottawa purpose-built vacancy rate of 2.9% across 86,550 units, City of Ottawa average rent of $1,741 and median rent of $1,675
- 2026 Tax Policy and Other Revenue Matters · City of Ottawa, Revenue Services · retrieved Supports: Ontario's last province-wide reassessment was completed in 2016 and municipalities rely on 2016 assessment values for the 2026 tax year, The average urban Ottawa home is assessed at $415,000, A 2026 net municipal increase of $184 on that home: $166 from the 3.75% budget increase and $18 from the multi-residential ratio change, The 2026 budget was approved on 10 December 2025 with a 3.75% overall municipal tax increase, Ottawa's 2025 average municipal taxes on a representative two-storey detached house were $5,490, the lowest of Ontario's ten largest municipalities
- Education property tax rates · Government of Ontario · retrieved Supports: The residential education tax rate of 0.153% of assessed value, unchanged since 2020
- Premium information for homeowner and small rental loans · Canada Mortgage and Housing Corporation · retrieved Supports: Mortgage default insurance premium rates by loan-to-value
- Regulations amending the Insurable Housing Loan Regulations and the Eligible Mortgage Loan Regulations (SOR/2025-55) · Canada Gazette, Part II · retrieved Supports: The $1.5 million insured price cap, 30-year amortization for first-time buyers and new builds
- Minimum qualifying rate for uninsured mortgages · Office of the Superintendent of Financial Institutions · retrieved Supports: The qualifying rate of the contract rate plus two points, or 5.25%
- Interest rates charged for new and existing lending by chartered banks · Bank of Canada · retrieved Supports: The default mortgage rate of 4.34%, uninsured five-year-plus fixed, funds advanced May 2026
- Calculating Land Transfer Tax · Ontario Ministry of Finance · retrieved Supports: Provincial transfer tax brackets, The conditional 2.5% band
- Municipal Land Transfer Tax rates and fees · City of Toronto · retrieved Supports: Toronto municipal transfer tax brackets, First-time buyer rebate
- Residential rent increases · Government of Ontario · retrieved Supports: 2026 rent increase guideline of 2.1%, The 2018 occupancy exemption
- Retail Sales Tax · Government of Ontario · retrieved Supports: 8% retail sales tax on insurance premiums
- NTREIS monthly MLS summary report, August 2026 · North Texas Real Estate Information System and the Texas Real Estate Research Center at Texas A&M University, via the MetroTex Association of REALTORS · retrieved Supports: A median single-family sale price of $327,000 in the City of Fort Worth in August 2026 on 805 sales, against $330,000 on 884 sales in August 2025, and an average of $377,572, A median townhouse sale price of $365,000 on 20 sales, against $319,990 on 21, and a median condominium sale price of $330,000 on 16 sales, against $260,000 on 11, 3,086 active single-family listings and 3.6 months of inventory in the City of Fort Worth, A median single-family lease of $2,195 a month on 470 leases, against $2,150 on 453 a year earlier, A median single-family sale price of $343,000 in Tarrant County on 1,736 sales, and $352,250 in the Fort Worth-Arlington-Grapevine metropolitan division, City figures by property type only, with no all-types median; report produced 7 September 2026
- Housing market reports · MetroTex Association of REALTORS · retrieved Supports: Monthly reports featuring data from the Texas A&M Real Estate Research Center, based on listings of properties physically located within the specified geographic areas
- Zillow Home Value Index, all homes, middle tier, smoothed and seasonally adjusted, by city · Zillow Research · retrieved Supports: A typical home value of $295,800 for the city of Fort Worth (region 18172) in August 2026, $301,195 in August 2025, so a fall of 1.8% over the year
- Zillow Home Value Index, single-family and condominium series, by city · Zillow Research · retrieved Supports: A typical single-family value of $296,280 in the city of Fort Worth in August 2026, against $301,707 a year earlier, down 1.8%, A typical condominium value of $243,575 in the same month, against $248,614, down 2.0%, from the condominium file at https://files.zillowstatic.com/research/public_csvs/zhvi/City_zhvi_uc_condo_tier_0.33_0.67_sm_sa_month.csv
- Fort Worth Rent Report, October 2026 · Apartment List · retrieved Supports: A median rent of $1,141 for a one-bedroom and $1,317 for a two-bedroom in the city of Fort Worth, and $1,336 across all bedroom sizes, Rents down 0.2% over September and down 1.7% over the past 12 months, against -2.1% for the state
- Apartments for rent in Fort Worth, TX: average rent · Apartment List · retrieved Supports: Average listed rents of $1,279 and up for a studio, $1,352 and up for one bedroom, $1,661 and up for two, and $2,066 and up for three or more
- FY 2026 fair market rents, Fort Worth-Arlington, TX HUD Metro FMR Area · United States Department of Housing and Urban Development · retrieved Supports: FY 2026 fair market rents of $1,473 for one bedroom, $1,723 for two and $2,273 for three, as gross rents including utilities, The FMR area as Johnson, Parker and Tarrant counties
- Zillow Observed Rent Index, all homes plus multifamily, smoothed, by city · Zillow Research · retrieved Supports: An observed rent index of $1,615 for the city of Fort Worth in August 2026, against $1,606 a year earlier, up 0.54%
- Rates and exemptions: 2025 tax rates per $100 valuation, and detail · Tarrant County Tax Assessor-Collector · retrieved Supports: 2025 rates per $100: Tarrant County 0.186200, City of Fort Worth 0.670000, Fort Worth ISD 1.029100, Keller ISD 1.085200, Tarrant County College 0.112280, JPS Health Network 0.165000, Tarrant Regional Water District 0.026500, Maintenance and debt splits: Tarrant County 0.173000 and 0.013200, City of Fort Worth 0.522500 and 0.147500, Fort Worth ISD 0.786900 and 0.242200, Keller ISD 0.755200 and 0.330000, Tarrant County College 0.096280 and 0.016000, JPS 0.155100 and 0.009900, water district 0.026500 and none, from https://entityportal.tarrantcountytx.gov/ratesExemptions.asp, Homestead exemptions of 20% (minimum $5,000) for Tarrant County, the City of Fort Worth and JPS Health Network, 1% (minimum $5,000) for Tarrant County College, none for the Tarrant Regional Water District, and $140,000 for Fort Worth ISD and Keller ISD, Eagle Mountain-Saginaw ISD at 1.245700, Crowley ISD at 1.255200 with a 10% local option, Emergency Service District 1 at 0.074348, Far North Fort Worth MUD at 1.000000 and Live Oak Creek MUD at 0.942000, Fort Worth public improvement district assessments per $100: PID 1 Downtown 0.125, PID 6 Park Glen 0.155 residential, PID 7 Heritage 0.145 residential, PID 11 Stockyards 0.12, PID 12 Chapel Hill 0.14, PID 14 Trinity Bluff 0.10, PID 15 Sun Valley 0.24, PID 19 Historic Camp Bowie 0.10, PID 20 East Lancaster Avenue 0.266, PID 21 Las Vegas Trail 0.10
- 2025 tax rates per $100 valuation for Tarrant County, last updated 8 October 2025 · Tarrant Appraisal District · retrieved Supports: The same 2025 rates and homestead exemptions for the county, the City, the hospital district, the college, the water district and every school district in the county, Northwest ISD at 1.0841 per $100 for 2025, No 2026 table yet: https://www.tad.org/content/rates/2026TaxRates.pdf returned not found, from https://www.tad.org/resources/rates
- Residential property data, 2026 appraisal roll · Tarrant Appraisal District · retrieved Supports: 255,731 single-family accounts inside the City of Fort Worth in Tarrant County, 121,356 of them in Fort Worth ISD, 33,569 in Eagle Mountain-Saginaw ISD and 32,861 in Keller ISD, 120,071 of the 121,356 City of Fort Worth and Fort Worth ISD single-family accounts carrying the Tarrant Regional Water District
- Tarrant water district lowers property tax rate, but cities will pay more for water use · Fort Worth Report · retrieved Supports: The water district's taxing district, established in 1949, is primarily in Fort Worth and funds operation and maintenance of the 27-mile Fort Worth Floodway
- Valuing property: limitation on residence homestead value increases · Texas Comptroller of Public Accounts · retrieved Supports: A residence homestead's appraised value may not rise more than 10% a year once the owner has qualified in the preceding and current year
- 2020 block assignment files, Texas: unified school districts and places · United States Census Bureau · retrieved Supports: Read with the 2020 redistricting file's block populations, at https://www2.census.gov/programs-surveys/decennial/2020/data/01-Redistricting_File--PL_94-171/Texas/tx2020.pl.zip, and the district names in https://www2.census.gov/geo/docs/maps-data/data/gazetteer/2025_Gazetteer/2025_Gaz_unsd_national.zip, Of the City of Fort Worth's 918,915 residents in 2020: 473,224 in Fort Worth ISD, 119,281 in Keller ISD, 83,129 in Eagle Mountain-Saginaw ISD, 81,929 in Crowley ISD, 67,070 in Northwest ISD, 27,617 in Hurst-Euless-Bedford ISD, 17,470 in White Settlement ISD and 16,049 in Everman ISD, 473,224 of Fort Worth ISD's 519,747 residents inside the city
- 2025 Gazetteer files: places, Texas · United States Census Bureau · retrieved Supports: A land area of 352.011 square miles and a water area of 8.183 square miles for Fort Worth city
- Extraterritorial Jurisdiction (ETJ) · City of Fort Worth Development Services · retrieved Supports: The ETJ as the unincorporated land within five miles of the city limits, where the City can regulate some activities, Water control and improvement districts, fresh water supply districts and municipal utility districts in the ETJ, under the City's MUD policy of 2005
- Extraterritorial Jurisdiction (ETJ) layer, City of Fort Worth open data boundaries · City of Fort Worth · retrieved Supports: The ETJ's polygons summing to 164,965 acres, about 258 square miles, with the latest edit dated 1 September 2026
- Public Improvement Districts (PIDs) · City of Fort Worth · retrieved Supports: Fifteen districts listed: 1 Downtown, 6 Park Glen, 7 Heritage, 11 Stockyards, 12 Chapel Hill, 14 Trinity Bluff, 15 Sun Valley, 16 Walsh Ranch/Quail Valley, 17 Rock Creek Ranch, 18 Tourism, 19 Historic Camp Bowie, 20 East Lancaster Avenue, 21 Las Vegas Trail, 22 Veale Ranch and 23 Panther Island, PIDs 16 and 17, formed in 2016, supporting streets, drainage, water, sewer and other infrastructure; PID 22 Veale Ranch established in 2023 for a 60-year term; PID 23 established in 2026
- Fort Worth Public Improvement District No. 16 (Walsh Ranch/Quail Valley): annual service plan update, fiscal year 2027, 25 August 2026 · City of Fort Worth and MuniCap · retrieved Supports: Fiscal 2027 annual installments per lot in Improvement Area 1 of $482.14 for a 35-foot lot, $597.93 for 50 feet, $737.46 for 60 feet, $940.24 for 70 feet and $1,558.83 for a custom lot, Assessments bearing interest at the rate on the district's bonds, 4.63%, repaid over twenty annual installments, eighteen of them outstanding
- Central City · Tarrant Regional Water District · retrieved Supports: The rerouting of a section of the Trinity River due north of downtown, with flood water storage at Gateway Park, The Army Corps of Engineers building the bypass channel, three isolation gates, a dam, a pump station and ten flood water storage areas; the water district, the City and the state building the rest
- Army Corps awards contract for first half of major $1.2B Fort Worth flood control, development project · Tarrant Regional Water District, republishing WFAA of 24 September 2026 · retrieved Supports: A $169,431,703 contract with Walsh Construction Company for the north bypass channel, An 800-acre island, and 2,400 acres of land protected from flooding
- $403M coming to Panther Island · Tarrant Regional Water District, republishing the Fort Worth Star-Telegram of 19 January 2022 · retrieved Supports: A 1.5-mile bypass channel connecting the Clear and West Forks of the Trinity River north of downtown Fort Worth
- Gas Wells and Gas Compressor/Well Pad Sites layers, planning and development map service · City of Fort Worth · retrieved Supports: 2,351 gas wells, 1,955 of them producing, 287 abandoned, 84 water disposal, 13 permitted and 12 applying, in a layer last edited in December 2025, 529 gas compressor and well pad sites, from layer 9
- Gas well drilling · City of Fort Worth Development Services · retrieved Supports: The Barnett Shale as a natural gas reserve under a 15-county area, about 1.5 miles below the surface, No well drilled closer than 600 feet to a residence, religious institution, public building, hospital, school or public park without a waiver from the protected use owners or City Council approval
- Garbage service · City of Fort Worth Environmental Services · retrieved Supports: Monthly rates of $13.75, $19.50 and $25.75 for the 32-, 64- and 96-gallon garbage cart, shown as effective 1 January 2024, Solid waste fees billed on the Fort Worth water bill as a sanitation fee, with recycling and yard waste collected at no additional charge
- Stormwater utility fee · City of Fort Worth · retrieved Supports: Residential rates from 1 January 2026 of $3.65 a month up to 1,300 square feet of hard surface, $7.29 to 2,475, $10.94 to 3,394 and $14.58 above it, on the monthly water bill
- Primary Mortgage Market Survey, 24 September 2026 · Freddie Mac · retrieved Supports: A 30-year fixed-rate mortgage averaging 7.03%, up from 6.95% the week before and 6.30% a year earlier
- Texas homeowners insurance market overview · Texas Department of Insurance · retrieved Supports: A statewide average homeowners premium of $3,489 a year for 2025, Hail as the largest cause of paid homeowners losses, $4.93 billion in 2024 against $2.21 billion for wind
- How much is homeowners insurance in Fort Worth, TX? · Insure.com · retrieved Supports: An average Fort Worth premium of $4,290 a year for $300,000 of dwelling cover, $100,000 of liability and a $1,000 deductible, updated 27 May 2026, An average of $3,342 a year for $200,000 of dwelling cover
- Texas homeowners insurance · NerdWallet · retrieved Supports: An average Fort Worth premium of $5,600 a year for $500,000 of dwelling cover, $300,000 of liability and a $1,000 deductible, updated 20 February 2026
- Renters insurance in Texas · NerdWallet · retrieved Supports: An average Fort Worth renters premium of $167 a year, $14 a month, for $30,000 of personal property, updated 23 September 2026
- Monthly homeowners' association and condominium fee, tables B25142 and B25143, 2024 American Community Survey 1-year estimates, Fort Worth city · United States Census Bureau, via the Census Reporter API · retrieved Supports: A median monthly association fee of $55 among Fort Worth owner-occupied units that pay one, 85,299 of 210,450 owner-occupied units, or 40.5%, paying such a fee, and 7,153 paying $500 or more a month
- Homebuyer Assistance Program (HAP) · City of Fort Worth Neighborhood Services · retrieved Supports: Up to $25,000 of interest-free assistance toward the down payment and closing costs, as a forgivable loan: forgiven after ten years in the home, or after five on $14,999 or less, Income limits updated July 2026 of $61,800 for one person to $88,250 for four, First-time buyers, or anyone who has not owned a home in three years; an eight-hour homebuyer class; a contribution of $1,000 or 2% of the price, whichever is less; a home inside the city limits; a sales price no more than 95% of the area median, under the HOME rules