Ottawa vs Miami: which should you move to?
Ottawa or Miami? Housing, rent, crime, climate, income, taxes and transit, side by side, from each city's own published figures. Written for someone deciding where to live, not for a ranking.
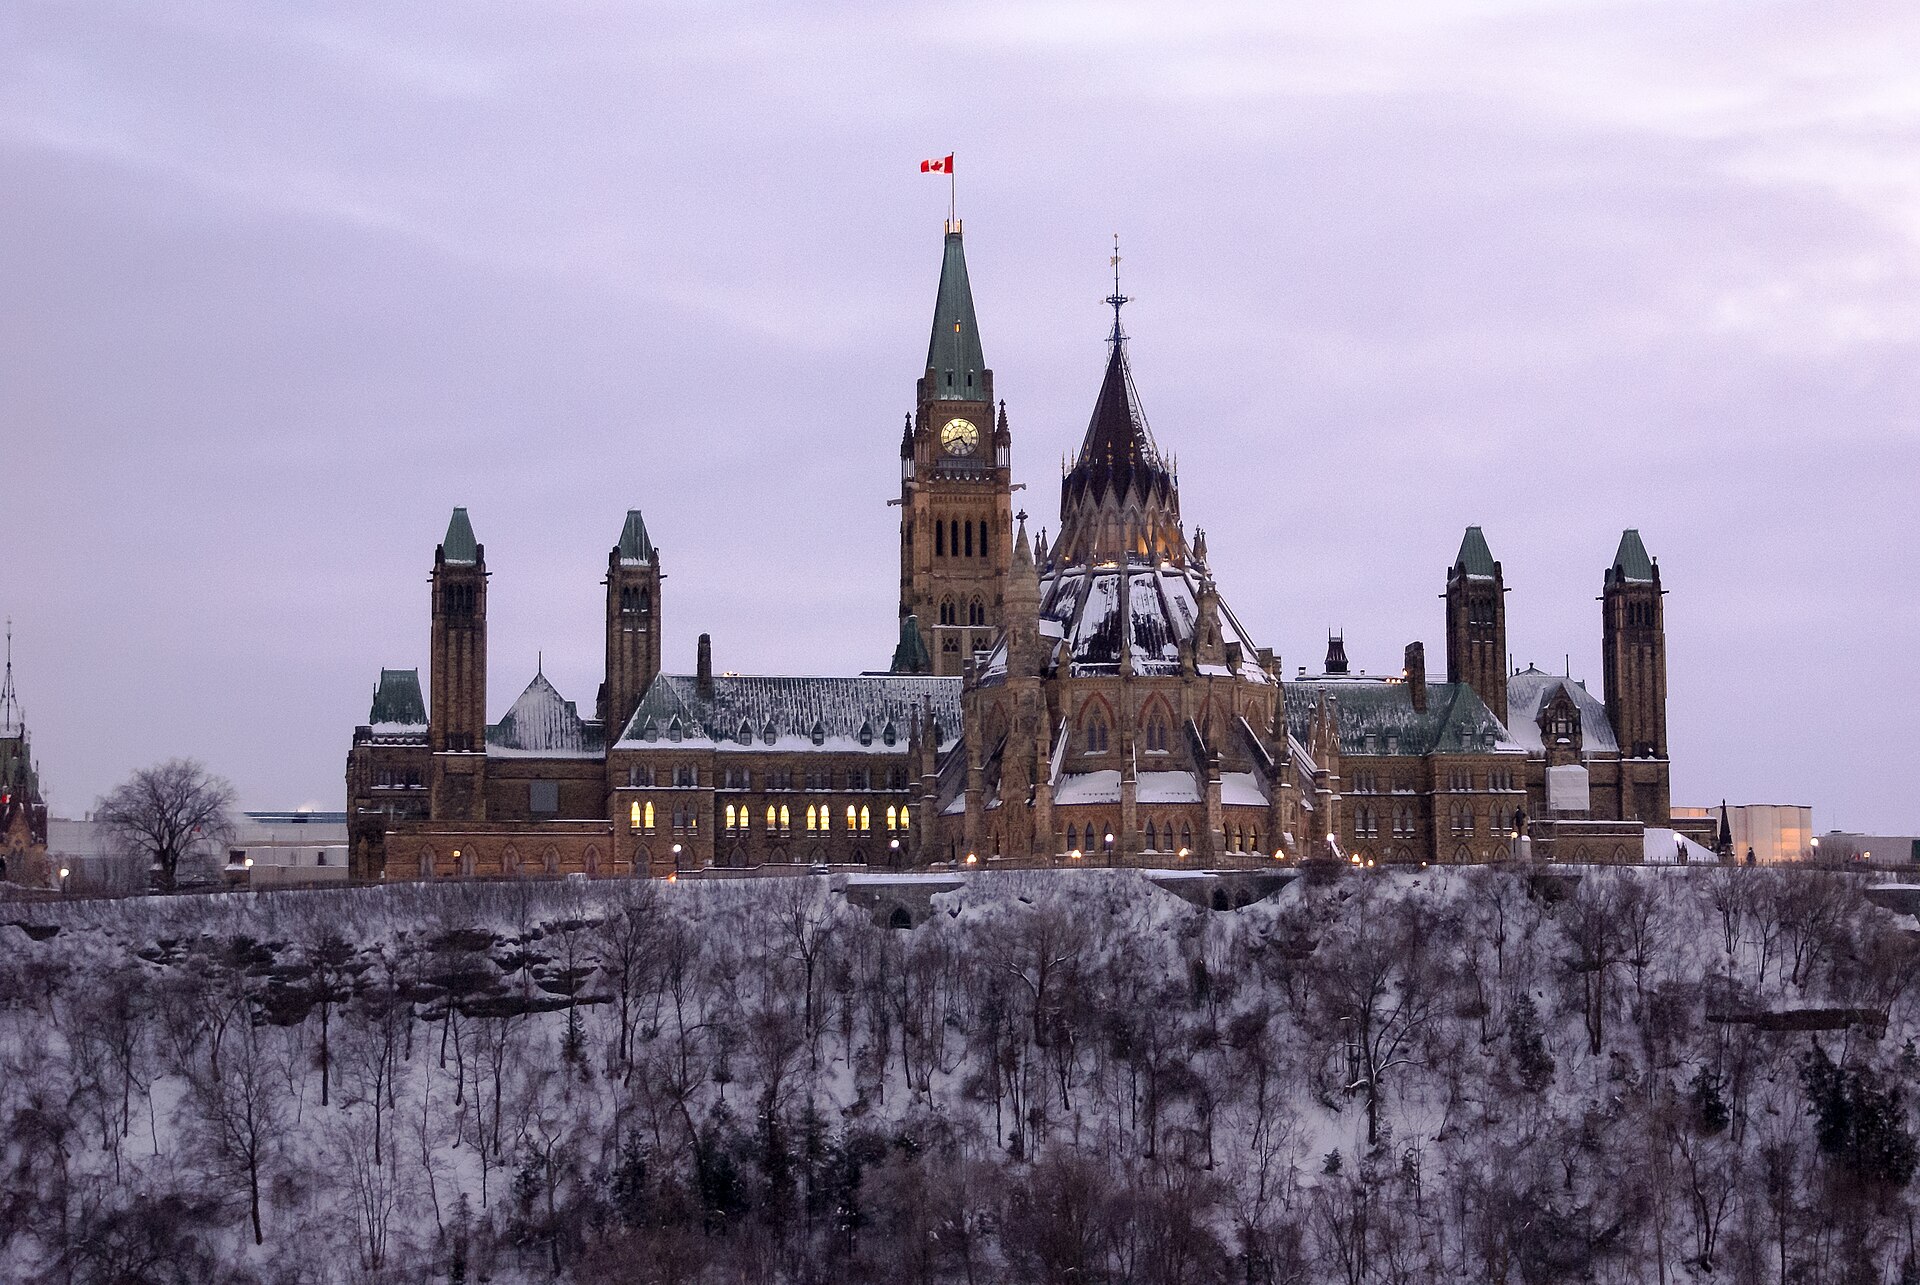

.jpg)

This choice comes down to whether you are paid in a way that survives Miami's carrying costs. Miami's benchmark house, $582,621 USD in June 2026, is a little cheaper than Ottawa's $634,000 CAD, but the first-year property tax is about $10,808 against $5,262, insurance runs $505 a month against $145, and a two-bedroom rents for $3,004 against $1,916. Miami wins for people with a high income, no dependence on public health care and a strong preference for winter at 20 C. Ottawa wins for households on two ordinary salaries who want a predictable budget, a family doctor eventually, and a detached house at $725,000 CAD.
Ottawa prices are in CAD and Miami prices are in USD. The tables leave them in their own currency and compare ratios and rates instead; a conversion would be stale by the time you read it.
| Measure | Ottawa | Miami | Advantage |
|---|---|---|---|
| City population | 1,188,114 (2025) | 489,812 (2025) | Not directly comparable |
| Metro population | 1,700,014 (2025) | 6,391,072 (2025) | Not directly comparable |
| Five-year growth Growth is pressure on rents and roads as much as it is opportunity, so it is reported without a winner. | 8.9% (2016-2021) | 10.8% (2020-2025) | Not directly comparable |
What a home costs in each
The figures the two cities' rent-versus-buy and mortgage calculators run on, read from the same tables.
| Measure | Ottawa | Miami | Advantage |
|---|---|---|---|
| Benchmark home price MLS® HPI or equivalent benchmark. Lower is treated as the advantage, which is the buyer's view rather than the owner's. | $634,000 (July 2026) | $582,621 (June 2026) | Not directly comparable |
| Detached house benchmark Miami publishes a single house index rather than a composite, so the two rows repeat. | $725,000 | $582,621 | Not directly comparable |
| Apartment or condominium benchmark | $385,500 | Not published | Not directly comparable |
| Two-bedroom rent | $1,916/mo (average, October 2025) | $3,004/mo (median, June 2026) | Not directly comparable |
| One-bedroom rent | $1,593/mo | $2,583/mo | Not directly comparable |
| Two-bedroom rent against median income A year of two-bedroom rent as a share of the median household income below. A household paying the median rent out of the median income is a fiction, but it is the same fiction in both columns and it crosses currencies. | 22.5% of a year's income | 54.3% of a year's income | Ottawa |
| Mortgage payment on the benchmark, 20% down 25 years in Ottawa against 30 in Miami, each compounding the way its own country's lenders do. The rates are not a spread you can shop: they are what each market charges. | $2,762/mo at 4.34% | $2,998/mo at 6.67% | Not directly comparable |
| Price to household income Benchmark price divided by the median household income below. A ratio is comparable across currencies; the dollars are not. | 6.2× | 8.8× | Ottawa |
| Property tax on the benchmark home The effective rate on market value, which is what the two rates have in common and what the Advantage column is decided on; the bills are in each city's own dollars. | $5,262/yr (0.83%, 2026) | $10,808/yr (1.855%, 2025) | Ottawa |
| Transfer tax on the benchmark home Compared as a share of the price. Where the seller pays it, it is a cost of leaving rather than arriving. | $9,155 (buyer pays) | $3,496 (seller pays) | Miami |
| Rent control A cap protects a sitting tenant and does nothing for the next lease, so neither column is simply better. | 2.1% guideline (2026) | Forbidden by state law | Not directly comparable |
Ottawa: About 0.83% of market value. Ottawa levies roughly 1.26%, but against a Current Value Assessment frozen at 1 January 2016 values, because Ontario has deferred every reassessment since. The average urban home is assessed at $415,000 and pays about $5,246 in 2026, which on the $634,000 composite benchmark is 0.83%. Ottawa's municipal taxes on a representative detached house were the lowest of Ontario's ten largest cities in 2025. Miami: About 1.86% of what you pay for the house, which is lower than the 19.9878 mills charged here, and the difference is Florida's homestead exemption rather than any assessment lag. The state assesses at full market value and a purchase resets the assessment to the price. What there is instead is an exemption: $25,000 of taxable value comes off for every taxing authority and a second slice comes off for all of them except the school district, which levies 6.4990 of the 19.9878. That second slice was $25,000 through the 2024 tax roll and has been adjusted for inflation every 1 January since, under the 2024 amendment to Article VII section 6 of the state constitution, so it is now somewhat more than $25,000. The figures here use the base amount, because the Department of Revenue sends the adjusted figure to the county property appraisers rather than publishing it. The difference is worth a few dollars a year on a bill, and the county property appraiser can tell you the amount in force. A homesteaded buyer's first-year bill is therefore about $10,808 on the $582,621 typical home value here. Miami runs its own fire department, so it pays none of the county's 2.3965-mill Fire Rescue district levy. One of only five municipalities in Miami-Dade in that position, and worth more than most municipal rates on this table. The exemption is not automatic: you file for it with the Miami-Dade Property Appraiser by 1 March of the year after you buy. The seller's tax bill is not a guide to yours. Save Our Homes caps a homesteaded property's assessed value at 3% growth a year, and that cap resets to full market value the January after the sale, so a long-tenured owner can be taxed on a fraction of what you will be taxed on for the same house. Ask the property appraiser what the assessment would be at your purchase price, not what the current bill is.
How safe each city is, by the numbers it publishes
Police-reported figures for the most recent year each force or statistics agency has released. Rates describe a whole city or metro area, and the spread between neighbourhoods inside one city is usually wider than the gap between the two cities.
| Measure | Ottawa | Miami | Advantage |
|---|---|---|---|
| Crime Severity Index Statistics Canada's weighted index for the metropolitan area, where 100 is Canada in 2006. American cities have no equivalent series. | 50.6 (2025) | Not published | Not directly comparable |
| Violent crime per 100,000 Canada counts every violent Criminal Code incident; the FBI counts four offences. The Canadian figure is always the larger one for that reason alone. | 814 (2025) | 359 (2025) | Not directly comparable |
| Property crime per 100,000 | 2,835 (2025) | 2,241 (2025) | Not directly comparable |
| Homicides Counts, not rates, and a single year in a small city moves a long way on chance alone. What each figure covers is under the table. | 21 (2025) | 26 (2025) | Not directly comparable |
The Ontario-part CSI rose from 46.85 in 2021 to 54.20 in 2023, held at 54.12 in 2024 and fell 6% to 50.61 in 2025 (table 35-10-0026-01). The violent crime rate has kept climbing, from 744 per 100k in 2021 to 814 in 2025, while property crime peaked in 2024 at 2,957 per 100k and eased to 2,835 in 2025.
What the rates cover: Total violent Criminal Code violations, rate per 100,000, Ottawa-Gatineau CMA Ontario part, table 35-10-0177-01 (10,745 incidents).
Homicides: Ottawa-Gatineau CMA Ontario part, table 35-10-0177-01; rate 1.59 per 100,000. 2024 was 27 (2.10 per 100k), the highest of the last five years.
FBI CDE counts for Miami PD show violent offenses falling from 2,245 in 2023 to 2,225 in 2024 and 1,787 in 2025 (a 20 percent one-year drop), property offenses from 13,928 to 11,178, and homicides from 61 in 2020 to 26 in 2025. Mid-2025 the department reported robberies down 17 percent and auto thefts down 37 percent against the first half of 2024.
What the rates cover: Miami Police Department (ORI FL0130600), FBI Crime Data Explorer NIBRS summarized data, 1,787 violent offenses in calendar 2025 against a CDE agency population of 498,792. 2024: 2,225 offenses, 483.1 per 100k. Miami PD moved to NIBRS mid 2022, so 2021 is blank and 2022 is a partial year in the CDE.
Homicides: Miami PD, FBI CDE: 26 murders and nonnegligent manslaughters in 2025, 5.2 per 100k. 2024: 29 (6.4 per 100k), 2023: 32 (7.1), 2020: 61 (12.8). Miami PD said in July 2025 the city might beat its record low of 24 set in 1946.
Winters, summers and what the weather can do to a house
| Measure | Ottawa | Miami | Advantage |
|---|---|---|---|
| January mean | -10.0 °C | 20.3 °C | Not directly comparable |
| July mean | 21.2 °C | 28.9 °C | Not directly comparable |
| Precipitation a year | 930 mm | 1,712 mm | Not directly comparable |
| Snowfall a year | 232 cm | 0 cm | Not directly comparable |
| Sunshine a year | 2,084 hours | 3,154 hours | Miami |
Environment and Climate Change Canada 1991-2020 normals at Ottawa Macdonald-Cartier Int'l A (climate ID 6106000). Annual mean 6.5 C, rainfall 757.2 mm. Sunshine hours are from the 1981-2010 normals at Ottawa CDA (climate ID 6105976) because the 1991-2020 airport table does not publish sunshine totals.
Hazards: Cold winters with regular snowstorms and freezing rain, spring flooding along the Ottawa River (2017 and 2019), summer heat and humidity, occasional severe thunderstorms and tornadoes (September 2018, the May 2022 derecho), and wildfire smoke episodes such as June 2023.
NOAA NCEI 1991-2020 monthly normals at Miami International Airport (USW00012839): January mean 68.6 F, July 84.1 F (August is warmest at 84.2 F), annual mean 77.4 F, annual precipitation 67.41 in, snow 0. Sunshine about 3,154 hours a year comes from NOAA Comparative Climatic Data (older period), not the 1991-2020 normals. Hazards: hurricanes and storm surge, seasonal king tide and rainfall flooding, heat and humidity from May to October, frequent thunderstorms (roughly 80 thunder days a year).
Hazards: Hurricanes and storm surge every June to November, with chronic tidal and rain flooding; windstorm and separate NFIP or private flood cover are a real carrying cost and coastal home premiums commonly run $4,000 to $7,000 a year or more.
What people earn and what the government takes
| Measure | Ottawa | Miami | Advantage |
|---|---|---|---|
| Median household income | $102,000 CAD (2020) | $66,337 USD (2024) | Not directly comparable |
| Unemployment rate Statistics Canada and the Bureau of Labor Statistics define unemployment slightly differently; the Canadian measure runs about a point higher on the same labour market. | 6.8% (July 2026) | 3.0% (June 2026) | Not directly comparable |
| Sales tax | 13% | 7% | Miami |
| Top marginal income tax Federal plus provincial or state. The American figure leaves out payroll taxes and the cost of health insurance, both of which a Canadian household covers through the tax it pays here. | 53.53% | 37% | Miami |
| Income tax on $100,000, single filer Computed from each jurisdiction's brackets at a single filer's $100,000 and rounded to the dollar, so a gap of a dollar is rounding rather than tax. Two cities in one province or state are shown as Even, because there the two cells describe the same tax and whatever separates them is method. | $21,930 CAD | $13,449 USD | Not directly comparable |
The federal government is the anchor employer: 130,628 of 279,707 federal public servants were based in the National Capital Region at March 31, 2025, and Budget 2025 announced about 28,000 more public service job cuts by 2029. Regional unemployment ran from 6.4% in mid 2025 to 7.3% in late 2025 before easing to 6.8% in July 2026.
Main sectors: Federal public administration, Technology (Kanata North, Shopify, telecom and defence), Health care and hospitals, Post-secondary education, Tourism and national institutions.
Property tax is set by the City of Ottawa; not verified here.
Nonfarm employment in the Miami-Miami Beach-Kendall metropolitan division was 1,351,000 in June 2026, up 8,800 (0.7 percent) over the year, led by education and health services (+6,100) and professional and business services (+4,800); Broward shed 5,000 jobs over the same period. MIA handled nearly 3.5 million tons of cargo in 2025, the most of any US airport.
Main sectors: Trade, transportation and logistics (port and airport), Tourism and hospitality, Finance and professional services, Health care and education, Real estate and construction.
No state or local income tax. Property tax and insurance are the taxes and costs that bite in Miami: homestead exemption and the Save Our Homes 3 percent assessment cap favour long-time owners over new buyers.
Whether you need a car
| Measure | Ottawa | Miami | Advantage |
|---|---|---|---|
| System | OC Transpo (buses, O-Train Lines 1, 2 and 4, Para Transpo); STO serves Gatineau | Miami-Dade Transit (Metrorail, Metromover, Metrobus); Brightline and Tri-Rail regional rail | Not directly comparable |
| Commute by public transit | 11.2% (2021) | 7.7% (2024) | Ottawa |
| Walk or cycle to work | 8.5% (2021) | 5.7% (2024) | Ottawa |
| Airport | Ottawa Macdonald-Cartier International Airport, YOW, 4.9 million passengers in 2025, up 6% on 2024 (Ottawa International Airport Authority, 2025 results) | Miami International Airport, MIA, 55.3 million passengers in 2025 (about 1 percent below 2024's record 55.9 million), per Miami-Dade Aviation Department release of May 4 2026 | Not directly comparable |
70.6 million O-Train and bus trips in 2025, up 3.9% on 2024 (OC Transpo report to Transit Committee, February 12, 2026). Ridership fell in early 2026: 11.5 million trips in January-February versus 12.4 million a year earlier.
Miami-Dade Transit carried 80,797,500 unlinked trips in 2025 (APTA ridership report, as cited on Wikipedia): Metrorail 14,971,300, Metromover 7,683,800, the rest on Metrobus. Q4 2025 weekday averages: Metrorail 50,300, Metromover 25,600, system 259,400.
Health care, schools and what each city is like
Health care
Care is publicly funded through OHIP after a residency waiting period for newcomers, with prescription drugs, dental and vision outside the public plan for most working-age adults. The main hospitals are The Ottawa Hospital (Civic and General campuses), CHEO for children, the Queensway Carleton and Montfort; a replacement Civic campus was promised for 2028 but construction on the hospital itself had not begun as of 2026, and finding a family doctor is the hardest part of access, with the Ontario College of Family Physicians projecting 4.4 million Ontarians without one by 2026.
Education
The University of Ottawa (bilingual) and Carleton University are the large universities, with Algonquin College and La Cite for applied programs. Publicly funded schools run through four boards: the Ottawa-Carleton District School Board, the Ottawa Catholic School Board, and French-language public and Catholic boards, so French immersion and full French schooling are both widely available.
Living there
Ottawa is a government town that behaves like a mid-sized city: quiet downtown evenings, a large share of households with two stable incomes, and a weekend life built around the Rideau Canal, the Gatineau Park hills across the river and the river pathways. Winters are long and cold, with roughly 232 cm of snow in a normal year, and summers are warm and humid. The O-Train light rail has had reliability problems since it opened in 2019, and the bus network has been cut back, so most households still drive.
Health care
Care is paid for through employer or marketplace insurance, Medicare or Medicaid, and Florida has not expanded Medicaid, so the uninsured share runs above the national rate and emergency rooms carry the gap. Jackson Memorial, the public safety-net hospital with more than 1,500 licensed beds, is the teaching hospital of the University of Miami Miller School of Medicine; Baptist Health South Florida, Mount Sinai Medical Center and the Miami VA are the other large systems.
Education
Miami-Dade County Public Schools is the third largest district in the country but enrolled 313,220 students in 2025-26, down about 13,000 in a year as charters and vouchers grew, and the board approved school closures and consolidations in 2026. Florida International University enrolls roughly 50,000 students and the private University of Miami about 20,000; magnet programs such as Design and Architecture Senior High and the choice-heavy system mean school assignment is something families actively manage.
Living there
The city proper is dense, young and majority Hispanic, with Spanish as common as English in daily business, and it has grown almost 11 percent since 2020 on finance and tech arrivals who pushed rents and condo prices up fast. Summers are long, wet and hot, winters are the reason people stay, and every household budgets for hurricane season, windstorm insurance and flooded streets at king tide. Driving is the default outside the Metrorail and Metromover corridors, and traffic is the complaint residents raise most.
Where each city wins, and where it loses
Start with the monthly numbers, because the sticker prices mislead. Ottawa's composite benchmark was $634,000 CAD in July 2026 and the payment on it with 20% down at 4.34% is $2,762 a month. Miami's typical home was $582,621 USD in June 2026, and at 6.67% the same 20% down payment costs $2,998. Then the carrying costs diverge. A homesteaded Miami buyer's first-year tax bill is about $10,808, while Ottawa's is $5,262, and Miami home insurance is budgeted at $505 a month against $145. Add it up and the Miami house costs roughly $4,400 a month to hold versus about $3,350 in Ottawa, in different currencies. Renters see the same gap: a one-bedroom averaged $1,593 in Ottawa in October 2025 and a median $2,583 in Miami in June 2026. Ottawa has a 2.1% rent cap on pre-2018 units; Florida forbids any cap.
The crime figures do not compare cleanly across the border, so read them with care. Ottawa's 2025 violent rate of 813.79 per 100,000 counts every violent Criminal Code violation, including common assault and uttering threats, for the Ontario part of the CMA. Miami's 358.6 per 100,000 is the FBI's narrower count of murder, rape, robbery and aggravated assault by the Miami Police Department. The homicide rate is the one figure that means the same thing in both places: 1.59 per 100,000 in Ottawa (21 deaths in 2025) against 5.2 in Miami (26 deaths). Miami's direction is the better story, with homicides down from 61 in 2020 and violent offences down 20% in a year. Ottawa's Crime Severity Index fell 6% to 50.61 in 2025, well below the Canadian figure of 75.0, but its violent crime rate has climbed every year since 2021.
Ottawa's January mean is -10.0 C and a normal winter drops 231.9 cm of snow; Miami's January mean is 20.3 C and its July mean is 28.9 C with 1,712 mm of rain a year, most of it in summer thunderstorms. The hazards do different things to a house. In Ottawa the costs are a snow service, a furnace that runs six months, freezing rain on the power lines and the occasional tornado or derecho; the 2017 and 2019 Ottawa River floods hit low-lying neighbourhoods. In Miami the hazard is priced into the mortgage: hurricanes and storm surge from June to November, king tide flooding, and windstorm and flood cover that the profile puts at $4,000 to $7,000 a year or more for coastal homes. Miami gets about 3,154 hours of sun a year to Ottawa's 2,084, and nobody in Miami shovels.
Ottawa's median household income was $102,000 CAD in 2020, and the city's anchor is the federal government, with 130,628 public servants in the National Capital Region in March 2025 and about 28,000 cuts announced through 2029. Unemployment was 6.8% in July 2026. Miami's city median was $66,337 USD in 2024 (the metro's is $80,625), and Miami-Dade unemployment was 3.0% in June 2026, half of Ottawa's. On taxes, a single filer on $100,000 pays about $21,930 in Ottawa and about $13,449 in Miami, a gap of roughly $8,500 in each currency, and sales tax is 13% against 7%. What the Ottawa premium buys is OHIP. In Miami that money goes to employer or marketplace health insurance, and Florida has not expanded Medicaid, so a gap in coverage is a real risk between jobs.
Neither city lets you skip the car easily, but Ottawa comes closer. Its 2021 transit commute share was 11.2%, depressed by pandemic remote work, and OC Transpo carried 70.6 million trips in 2025 on buses and three O-Train lines, a system with reliability problems since 2019 and a bus network that has been cut back. Miami's city share was 7.7% in 2024 and the metro's just 2.6%; Metrorail and Metromover cover a few corridors and traffic is the complaint residents raise most. Walking and cycling account for 8.5% of Ottawa commutes and 5.7% of Miami's. For flying, the difference is enormous: Miami International handled 55.3 million passengers in 2025 and Ottawa's airport 4.9 million, so a Miami resident flies direct almost anywhere while Ottawa often connects through Toronto or Montreal.
Health care access is where the two cities trade places. Ottawa has The Ottawa Hospital, CHEO and the Queensway Carleton, all free at the point of use, but the Ontario College of Family Physicians projected 4.4 million Ontarians without a family doctor by 2026 and the replacement Civic campus promised for 2028 had not started construction. Miami has Jackson Memorial, Baptist Health and Mount Sinai, and wait times depend on your plan, as does the bill. Schools split the same way: Ottawa runs four public boards with French immersion everywhere, while Miami-Dade's district lost about 13,000 students in a year to charters and vouchers and is closing schools, so families manage assignment actively. Ottawa is a quiet government town with the Rideau Canal and Gatineau Park; Miami is dense, young, majority Hispanic and Spanish-speaking in daily business.
The thing people underestimate is how much of Miami's tax advantage gets handed straight back. The absence of state income tax saves a $100,000 earner about $8,500 relative to Ottawa, but the property tax on the benchmark home is $5,500 higher, insurance is about $4,300 a year higher, and health insurance comes out of your pay cheque too. For a renting household on an ordinary income, Miami's median two-bedroom at $3,004 is more than half of the city's median monthly household income; Ottawa's $1,916 is under a quarter. The arithmetic flips at high incomes, which is why Miami's finance and tech arrivals have done well there and why the city grew almost 11% since 2020. Decide by your pay stub, not by the January forecast.
Better here
- A two-bedroom averaged $1,916 in October 2025, against a $3,004 median in Miami, and units first occupied before November 2018 are capped at 2.1% increases for 2026.
- Property tax on the benchmark home is about $5,262 a year and home insurance about $145 a month, roughly half and under a third of Miami's figures.
- Homicides ran at 1.59 per 100,000 in 2025, against 5.2 in Miami, and the Crime Severity Index of 50.61 is well below Canada's 75.0.
- Median household income was $102,000 CAD in 2020, and the tax premium over Florida buys OHIP coverage rather than a monthly insurance bill.
- Transit carried 11.2% of commuters in 2021 and walking and cycling another 8.5%, both higher shares than Miami's 7.7% and 5.7%.
- There are no hurricanes, no windstorm deductible and no flood policy priced at $4,000 to $7,000 a year.
Worse here
- The January mean is -10.0 C and a normal winter brings 231.9 cm of snow; the July mean is 21.2 C and sunshine totals about 2,084 hours a year against Miami's 3,154.
- Unemployment was 6.8% in July 2026, against 3.0% in Miami-Dade, and the federal government has announced about 28,000 public service cuts by 2029.
- A single filer on $100,000 pays about $21,930 in income tax against $13,449 in Miami, and sales tax is 13% against 7%.
- The violent crime rate has risen every year since 2021, reaching 813.79 per 100,000 in 2025, even as the overall index fell.
- The airport handled 4.9 million passengers in 2025 against 55.3 million at Miami International, so most long-haul trips connect elsewhere.
- Finding a family doctor is the hardest part of health care, with 4.4 million Ontarians projected to be without one by 2026.
Choose Ottawa if
- you live on two ordinary salaries and want housing, tax and insurance costs you can forecast five years out
- you want a detached house, $725,000 CAD at the July 2026 benchmark, within a transit and cycling commute
- you or someone in your household needs ongoing medical care and cannot risk a gap in private coverage
- you can live with a six-month winter in exchange for no hurricane season
The Ottawa guide · Neighbourhoods · Ottawa rent vs buy · Ottawa mortgage calculator
Better here
- The January mean is 20.3 C, snowfall is zero and the city gets about 3,154 hours of sun a year.
- Miami-Dade unemployment was 3.0% in June 2026, and metro-division employment rose 8,800 in a year, led by health and professional services.
- A single filer on $100,000 pays about $13,449 in federal income tax and nothing to the state, against $21,930 in Ottawa.
- The FBI's violent offence rate fell 20% in a year to 358.6 per 100,000 in 2025, and homicides dropped from 61 in 2020 to 26.
- Miami International handled 55.3 million passengers in 2025, with direct flights across the Americas and Europe.
- The typical home was $582,621 USD in June 2026, below Ottawa's $634,000 CAD benchmark.
Worse here
- A homesteaded buyer's first-year property tax on the typical home is about $10,808, double Ottawa's $5,262, and a purchase resets the assessment to the price.
- Home insurance is budgeted at $505 a month, and coastal windstorm and flood cover commonly runs $4,000 to $7,000 a year or more.
- A one-bedroom had a median rent of $2,583 in June 2026, a thousand dollars above Ottawa's average, and Florida forbids any rent control.
- The city's median household income was $66,337 USD in 2024, so the benchmark home costs nearly nine years of income against about six in Ottawa.
- Homicides ran at 5.2 per 100,000 in 2025, more than three times Ottawa's rate.
- Hurricanes and storm surge threaten every June to November, and king tide flooding is a routine event, not a disaster.
Choose Miami if
- you earn well above the metro median and your employer covers good health insurance
- you work in trade, logistics, hospitality or finance, where Miami's port and airport concentrate the jobs
- winter is a deal-breaker and you will pay for hurricane cover to avoid it
- you fly often and want a hub airport rather than a connection through Toronto
The Miami guide · Neighborhoods · Miami rent vs buy · Miami mortgage calculator
Ottawa or Miami, in short
Is Ottawa or Miami cheaper to live in?
Ottawa, on nearly every line except income tax. The July 2026 benchmark home was $634,000 CAD with a $2,762 monthly payment, $5,262 in property tax and $145 a month in insurance. Miami's June 2026 typical home was $582,621 USD with a $2,998 payment, about $10,808 in first-year tax and $505 a month in insurance. Rents are further apart: a two-bedroom averaged $1,916 in Ottawa and a median $3,004 in Miami. Miami's income tax saving of roughly $8,500 on a $100,000 salary narrows the gap but does not close it, and the two figures are in different currencies.
Is Ottawa or Miami safer?
On homicide, the one measure counted the same way in both countries, Ottawa: 1.59 per 100,000 in 2025 against 5.2 in Miami. The headline violent rates point the other way (813.79 in Ottawa, 358.6 in Miami) but Canada counts every violent Criminal Code violation including common assault and threats, while the FBI figure covers only murder, rape, robbery and aggravated assault, so they are not comparable. Miami's trend is strongly downward, with violent offences down 20% in 2025. Ottawa's overall severity index fell 6% but its violent rate has risen each year since 2021.
Which has the better climate, Ottawa or Miami?
Miami for comfort, Ottawa for cost. Miami's January mean is 20.3 C, July is 28.9 C, and it gets about 3,154 hours of sun with no snow, but 1,712 mm of rain, heat and humidity from May to October, and a hurricane season from June to November that sets insurance at $4,000 to $7,000 a year for coastal homes. Ottawa's January mean is -10.0 C with 231.9 cm of snow, July is 21.2 C and humid, and the hazards are freezing rain, spring river flooding and occasional smoke. Ottawa's weather is harder on you; Miami's is harder on the house.
Do I need private health insurance in Miami, and what does it replace in Ottawa?
Yes. Miami care is paid through employer or marketplace insurance, Medicare or Medicaid, and Florida has not expanded Medicaid, so the uninsured share runs above the national rate. In Ottawa, OHIP covers doctors and hospitals after a residency waiting period, with drugs, dental and vision mostly left to employer plans. The income tax gap at $100,000, about $21,930 in Ottawa against $13,449 in Miami, is the rough price of that coverage. The catch in Ottawa is access: 4.4 million Ontarians were projected to be without a family doctor by 2026.
Where the figures come from
Housing figures are the ones behind each city's calculators, dated on those pages. The rest are listed here with the date they were retrieved. See the methodology for how facts, estimates and opinion are kept apart.
- Census Profile, 2021 Census of Population: Ottawa, City (CSD) and Ottawa-Gatineau (Ontario part) · Statistics Canada · retrieved Supports: population.city (2021 count), Five-year growth, Median household income, Transit commute share, Walk and cycle commute share
- Census Profile, 2021 Census of Population: Ottawa-Gatineau (CMA) · Statistics Canada · retrieved Supports: population.metro (2021 count), population.growthPct5y (CMA)
- Population estimates, July 1, by census subdivision, 2021 boundaries (table 17-10-0155-01) · Statistics Canada · retrieved Supports: City population
- Population estimates, July 1, by census metropolitan area and census agglomeration, 2021 boundaries (table 17-10-0148-01) · Statistics Canada · retrieved Supports: Metro population
- Crime severity index and weighted clearance rates, Canada, provinces, territories and Census Metropolitan Areas (table 35-10-0026-01) · Statistics Canada · retrieved Supports: Crime Severity Index, Crime trend
- Police-reported Crime Severity Index and crime rate, by census metropolitan area, 2025 · Statistics Canada, The Daily · retrieved Supports: Crime Severity Index, crime.propertyRatePer100k (all-crime rate context)
- Incident-based crime statistics, by detailed violations, Canada, provinces, territories, CMAs (table 35-10-0177-01) · Statistics Canada · retrieved Supports: Violent crime rate, Property crime rate, Homicides, Crime trend
- Ottawa crime rate increases in 2025, remains above Ontario average · Yahoo News Canada (Ottawa Police Service KPI report to the Police Services Board, January 26, 2026) · retrieved Supports: crime.index (OPS city CSI 55.8)
- Canadian Climate Normals 1991-2020, Ottawa Macdonald-Cartier Int'l A · Environment and Climate Change Canada · retrieved Supports: January mean, July mean, Annual precipitation, Annual snowfall
- Canadian Climate Normals 1981-2010, Ottawa CDA · Environment and Climate Change Canada · retrieved Supports: Sunshine hours
- Labour force characteristics by census metropolitan area, three-month moving average, seasonally adjusted (table 14-10-0459-01) · Statistics Canada · retrieved Supports: Unemployment rate, Labour market
- Labour Force Survey, July 2026 · Statistics Canada, The Daily · retrieved Supports: economy.unemploymentPct (Canada and Ontario comparison)
- Federal government to cut another 28,000 public service jobs by 2029 · CTV News Ottawa · retrieved Supports: Labour market
- Federal Government Jobs in Ottawa: 2026 Hiring Guide (citing Public Service Commission counts at March 31, 2025) · Via Ottawa · retrieved Supports: economy.note (NCR public servant count)
- 2025 and 2026 Combined Federal and Ontario Tax Rates Including Surtaxes · TaxTips.ca · retrieved Supports: Top marginal income tax, Income tax on $100,000
- Ontario Health Premium · TaxTips.ca · retrieved Supports: Income tax on $100,000
- 2025 Non-Refundable Personal Tax Credits, Base Amounts · TaxTips.ca · retrieved Supports: Income tax on $100,000
- Recap: February 12, 2026 Transit Committee · OC Transpo · retrieved Supports: Transit ridership
- OC Transpo sees drop in ridership to start 2026 · CTV News Ottawa · retrieved Supports: transit.ridershipNote (early 2026)
- A transformational year: Ottawa Airport Authority reports 2025 results · Ottawa International Airport Authority · retrieved Supports: Airport passengers
- More Than Four Million Ontarians Will Be Without a Family Doctor by 2026 · Ontario College of Family Physicians · retrieved Supports: Health care
- New Ottawa Civic hospital opening likely delayed by years, says project consultant · CBC News · retrieved Supports: Health care
- Miami, FL Population (2025) · Every City in the USA (republishing Census Bureau PEP Vintage 2025) · retrieved Supports: City population, Five-year growth
- U.S. Census Bureau QuickFacts: Miami city, Florida · US Census Bureau · retrieved Supports: population.city (page returned 403 on fetch; figure confirmed via search snippet and secondary republisher)
- Largest U.S. Metro Areas by Population 2026 (Vintage 2025 estimates) · statranker.org · retrieved Supports: Metro population
- Florida MSA population estimates, April 1 2025 · Florida Office of Economic and Demographic Research · retrieved Supports: population.metro (alternative state estimate)
- Miami, FL Metro Area and Miami city profiles, ACS 2024 1-year · Census Reporter · retrieved Supports: Median household income, population.metro (ACS)
- ACS 2024 1-year table B08301 Means of Transportation to Work · Census Reporter API (US Census Bureau data) · retrieved Supports: Transit commute share, Walk and cycle commute share
- Crime Data Explorer summarized agency data, Miami Police Department (FL0130600) · FBI · retrieved Supports: Violent crime rate, Property crime rate, Homicides, Crime trend
- Miami Police Report 20% Decrease in Homicides for 1st Half of 2025 · Officer.com · retrieved Supports: Crime trend, Homicides
- U.S. Climate Normals 1991-2020, monthly and annual, station USW00012839 Miami International Airport · NOAA National Centers for Environmental Information · retrieved Supports: January mean, July mean, Annual precipitation, Annual snowfall
- Comparative Climatic Data · NOAA NCEI · retrieved Supports: climate.sunshineHours (approximate; figure taken from search summaries of CCD, not the table itself)
- Climate of Miami · Wikipedia · retrieved Supports: climate.hazards (thunderstorm days, hurricane exposure)
- Broward County June 2026 Unemployment Data · CareerSource Broward (FloridaCommerce data) · retrieved Supports: Unemployment rate, Labour market
- Discretionary Sales Surtax Information (DR-15DSS) 2026 · Florida Department of Revenue · retrieved Supports: Sales tax
- IRS releases tax inflation adjustments for tax year 2025 · Internal Revenue Service · retrieved Supports: Top marginal income tax, taxes.incomeTaxAt100k (brackets)
- FAQ: The One Big Beautiful Bill Act Tax Changes · Tax Foundation · retrieved Supports: taxes.incomeTaxAt100k ($15,750 standard deduction)
- Miami-Dade Transit · Wikipedia (citing APTA Ridership Report) · retrieved Supports: Transit ridership
- Soaring cargo growth lifts MIA to #1 in the U.S., #3 in the world · Miami International Airport · retrieved Supports: Airport passengers, Labour market
- Miami (MIA) Airport & Passenger Statistics · RoadGenius · retrieved Supports: transit.airport (2024 comparison)
- A Guide to Florida Flood Insurance (2026) · Insurify · retrieved Supports: climate.hazards (insurance costs)
- Enrollment in Miami-Dade schools is lower at the start of this year. Why? · WLRN · retrieved Supports: Education
- FIU enrollment approaches 50,000 as fall semester nears · Miami Today · retrieved Supports: Education
- Jackson Memorial Hospital · Jackson Health System · retrieved Supports: Health care
- MLS® Home Price Index: Ottawa Real Estate Board, July 2026 · Canadian Real Estate Association / Ottawa Real Estate Board · retrieved Supports: Composite MLS® HPI benchmark of $634,000 in July 2026, down 0.5% year over year, Single-family benchmark of $725,000, up 0.7% year over year, Townhouse and row benchmark of $542,500, down 5.1% year over year, Apartment benchmark of $385,500, down 5.2% year over year, 1,325 sales and 4,678 active listings in July 2026
- Rental Market Survey: Ottawa, average rent by bedroom type, October 2025 · Canada Mortgage and Housing Corporation · retrieved Supports: Ottawa average purpose-built rents of $1,332 studio, $1,593 one-bedroom, $1,916 two-bedroom and $2,090 three-bedroom-plus, An overall average of $1,743 across 89,170 purpose-built units, Year-over-year increases of 3.4% on one- and two-bedroom units and 3.9% overall, Average rent of $2,320 in buildings completed in 2000 or later against $1,529 in buildings from before 1960
- Rental Market Statistics Summary: Ottawa (CV), October 2025 · Canada Mortgage and Housing Corporation · retrieved Supports: City of Ottawa purpose-built vacancy rate of 2.9% across 86,550 units, City of Ottawa average rent of $1,741 and median rent of $1,675
- 2026 Tax Policy and Other Revenue Matters · City of Ottawa, Revenue Services · retrieved Supports: Ontario's last province-wide reassessment was completed in 2016 and municipalities rely on 2016 assessment values for the 2026 tax year, The average urban Ottawa home is assessed at $415,000, A 2026 net municipal increase of $184 on that home: $166 from the 3.75% budget increase and $18 from the multi-residential ratio change, The 2026 budget was approved on 10 December 2025 with a 3.75% overall municipal tax increase, Ottawa's 2025 average municipal taxes on a representative two-storey detached house were $5,490, the lowest of Ontario's ten largest municipalities
- Education property tax rates · Government of Ontario · retrieved Supports: The residential education tax rate of 0.153% of assessed value, unchanged since 2020
- Premium information for homeowner and small rental loans · Canada Mortgage and Housing Corporation · retrieved Supports: Mortgage default insurance premium rates by loan-to-value
- Regulations amending the Insurable Housing Loan Regulations and the Eligible Mortgage Loan Regulations (SOR/2025-55) · Canada Gazette, Part II · retrieved Supports: The $1.5 million insured price cap, 30-year amortization for first-time buyers and new builds
- Minimum qualifying rate for uninsured mortgages · Office of the Superintendent of Financial Institutions · retrieved Supports: The qualifying rate of the contract rate plus two points, or 5.25%
- Interest rates charged for new and existing lending by chartered banks · Bank of Canada · retrieved Supports: The default mortgage rate of 4.34%, uninsured five-year-plus fixed, funds advanced May 2026
- Calculating Land Transfer Tax · Ontario Ministry of Finance · retrieved Supports: Provincial transfer tax brackets, The conditional 2.5% band
- Municipal Land Transfer Tax rates and fees · City of Toronto · retrieved Supports: Toronto municipal transfer tax brackets, First-time buyer rebate
- Residential rent increases · Government of Ontario · retrieved Supports: 2026 rent increase guideline of 2.1%, The 2018 occupancy exemption
- Retail Sales Tax · Government of Ontario · retrieved Supports: 8% retail sales tax on insurance premiums
- Zillow Home Value Index (ZHVI), all homes, mid-tier, smoothed and seasonally adjusted: city file, June 2026 · Zillow Research · retrieved Supports: A typical home value for the 35th to 65th percentile of each municipality's market, computed on one method across all twenty-four, The same series and month the Charlotte, Orlando and Palm Beach pages use, so all four American layers can be read against each other, Year-over-year change to June 2026
- Table 1: Comparison of Taxes Levied, county and municipal governments, fiscal years 2024-25 and 2025-26: Miami-Dade · Florida Department of Revenue, Property Tax Oversight · retrieved Supports: The adopted 2025-26 millage rate for Miami-Dade County and every municipality in it, The county's own components: countywide 4.5740, Fire/Rescue 2.3965, Library 0.2812 and the Unincorporated Municipal Service Area at 1.9090, Municipal rates from Sunny Isles Beach's 1.7000 to Biscayne Park's 9.3000
- 2025 millage rates and taxing authorities, Miami-Dade County · Miami-Dade County Property Appraiser · retrieved Supports: A published combined rate for unincorporated Miami-Dade of 16.9317 mills, Its components: school district 6.4990, countywide 5.7361, regional water districts 0.3911, Fire Rescue 2.3965 and UMSA 1.9090, which this layer's stack reproduces exactly, Millage code 0100, the City of Miami, at 19.9878 mills for 2025: 7.1080 of city operating levy and 0.2536 of city debt service on the countywide 12.6262, Opa-locka's municipal operating levy of 8.9797, and a 2025 total of 24.0024 for millage code 0800, A city debt service column, which nine of the twenty-four municipalities here carry: Miami 0.2536, Miami Beach 0.2779, North Bay Village 1.1666, Golden Beach 0.6000, Miami Shores 0.1331, North Miami Beach 0.2000, Miami Gardens 0.4331, Doral 0.4810 and Homestead 0.2446, A blank library district column for Hialeah, North Miami, North Miami Beach, Homestead, Miami Shores, Bal Harbour and Surfside, which are outside the county library district, A blank Fire Rescue column for Miami, Miami Beach, Coral Gables, Hialeah and Key Biscayne, which is the five this layer flags
- About Fire Rescue · Miami-Dade Fire Rescue · retrieved Supports: The Fire Rescue district covering the unincorporated county and twenty-nine municipalities, Miami, Miami Beach, Coral Gables, Hialeah and Key Biscayne operating their own fire departments and lying outside the district
- Documentary stamp tax · Florida Department of Revenue · retrieved Supports: A Miami-Dade deed rate of 60 cents per $100 rather than the 70 cents charged in every other county, A Miami-Dade surtax of 45 cents per $100, not due on a document transferring only a single-family dwelling, 35 cents per $100 on a promissory note, statewide
- Annual estimates of the resident population for incorporated places, 2020 to 2024 · United States Census Bureau, Population Estimates Program · retrieved Supports: 2020 census counts and 2024 estimates for each municipality, Miami at 487,014 and Hialeah at 235,388; Golden Beach at 1,034
- Average cost of home insurance in Florida, 2026 · MoneyGeek · retrieved Supports: A Miami-Dade County average of about $6,045 a year: below Palm Beach County's $6,614, A Florida average of about $3,815 and a national average of about $2,543
- Primary Mortgage Market Survey · Freddie Mac · retrieved Supports: 30-year fixed-rate mortgage averaging 6.67%
- Governmental leasehold intangible personal property tax and the non-recurring intangible tax on mortgages · Florida Department of Revenue · retrieved Supports: A non-recurring intangible tax of 2 mills: 0.2%, on the obligation secured by a mortgage on Florida real property
- Property tax exemptions and additional benefits · Florida Department of Revenue · retrieved Supports: A $25,000 homestead exemption applying to all taxing authorities and a second slice, $25,000 in the 2024 base year and adjusted for inflation each 1 January since, applying to all but the school district, The Save Our Homes assessment limitation of 3% or the change in CPI, whichever is lower, Portability of up to $500,000 of accrued Save Our Homes benefit to a new homestead, The 1 March filing deadline
- Chapter 2023-17, Laws of Florida: preemption of rent control · The Florida Senate · retrieved Supports: The repeal of the referendum exception that had allowed a local rent control ordinance in a declared housing emergency