Kelowna vs San Antonio: which should you move to?
Kelowna or San Antonio? Housing, rent, crime, climate, income, taxes and transit, side by side, from each city's own published figures. Written for someone deciding where to live, not for a ranking.
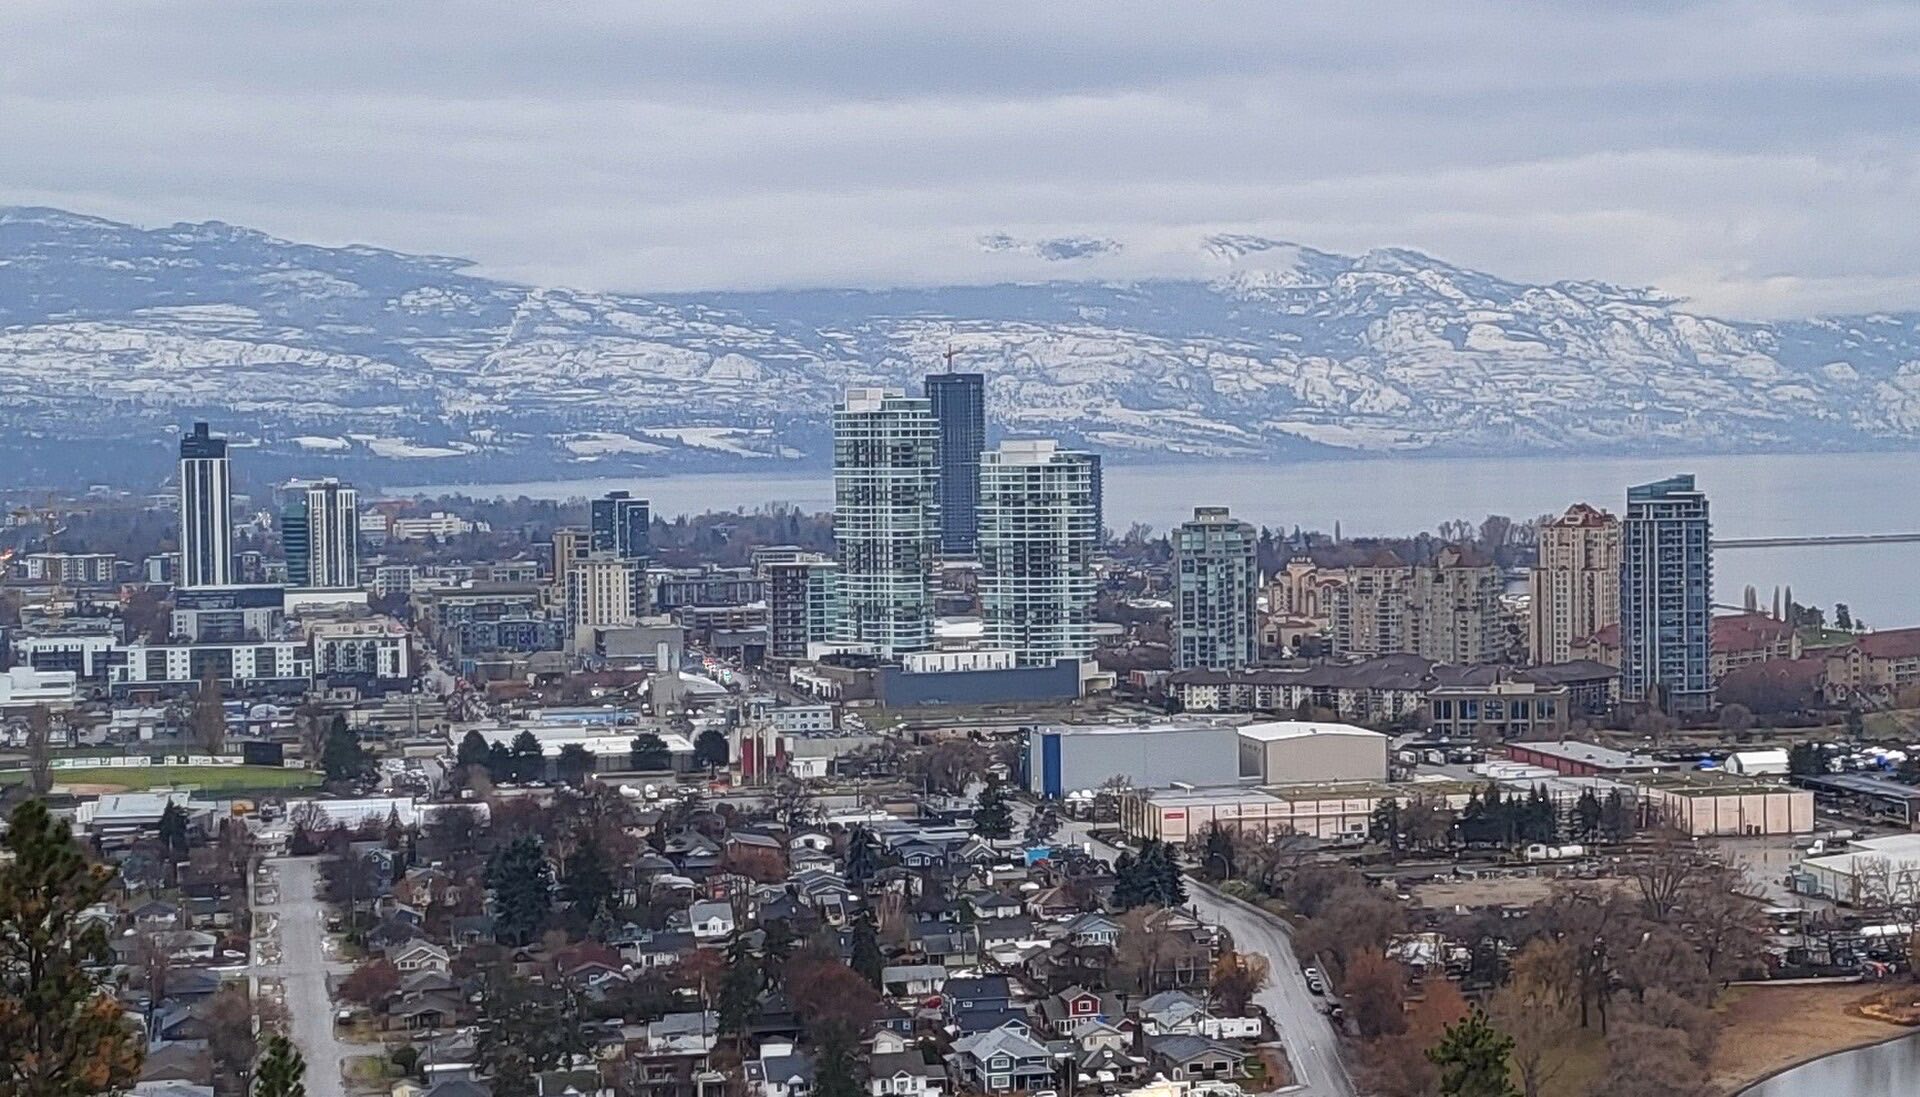
Kelowna
.jpg)

San Antonio

The two housing bills are in different currencies, and held against local pay they are far apart. Mortgage, property tax and insurance come to about $5,262 CAD a month on Kelowna's single-family benchmark, roughly 74% of the metro's 2020 median household income, and about $2,116 USD on the Bexar County median sale price, roughly 38% of the City of San Antonio's 2024 median, on homes that cost 12.6 and about 4.2 times those incomes; the San Antonio price is the county's, read against the city's pay. The tax sits in opposite places: a Kelowna earner pays about $20,500 CAD of $100,000 in federal and provincial income tax, while Texas levies none and collects $4,390 a year, an effective 1.56%, on the San Antonio median. San Antonio has the labor market, 4.7% metro unemployment in July 2026 on an unadjusted count against 9.3% in Kelowna, the highest of any Canadian metro, and the airport, with 10,740,694 passengers in 2025 against 2,315,432 at YLW. Homicide favors Kelowna, 4 in the metro in 2025, about 1.58 per 100,000, against 106 in San Antonio, about 6.8. Choose Kelowna if your income or equity comes with you and you want a dry 20.0 C July on a lake with coverage that comes with residency. Choose San Antonio to find work and to buy a house on a salary, with a flood policy on top.
Kelowna prices are in CAD and San Antonio prices are in USD. The tables leave them in their own currency and compare ratios and rates instead; a conversion would be stale by the time you read it.
| Measure | Kelowna | San Antonio | Advantage |
|---|---|---|---|
| City population | 166,278 (2026) | 1,548,422 (2025) | Not directly comparable |
| Metro population | 222,162 (2021) | 2,813,140 (2025) | Not directly comparable |
| Five-year growth Growth is pressure on rents and roads as much as it is opportunity, so it is reported without a winner. | 13.5% (2016-2021) | 8.0% (2020-2025) | Not directly comparable |
What a home costs in each
The figures the two cities' rent-versus-buy and mortgage calculators run on, read from the same tables.
| Measure | Kelowna | San Antonio | Advantage |
|---|---|---|---|
| Benchmark home price MLS® HPI or equivalent benchmark. Lower is treated as the advantage, which is the buyer's view rather than the owner's. | $1,072,400 (July 2026) | $280,999 (August 2026) | Not directly comparable |
| Detached house benchmark Kelowna publishes a single house index rather than a composite, so the two rows repeat. | $1,072,400 | $249,206 | Not directly comparable |
| Apartment or condominium benchmark | $490,700 | $167,371 | Not directly comparable |
| Two-bedroom rent | $2,132/mo (average, October 2025) | $1,179/mo (median, September 2026) | Not directly comparable |
| One-bedroom rent | $1,600/mo | $957/mo | Not directly comparable |
| Two-bedroom rent against median income A year of two-bedroom rent as a share of the median household income below. A household paying the median rent out of the median income is a fiction, but it is the same fiction in both columns and it crosses currencies. | 30.1% of a year's income | 21.4% of a year's income | San Antonio |
| Mortgage payment on the benchmark, 20% down 25 years in Kelowna against 30 in San Antonio, each compounding the way its own country's lenders do. The rates are not a spread you can shop: they are what each market charges. | $4,672/mo at 4.34% | $1,500/mo at 7.03% | Not directly comparable |
| Price to household income Benchmark price divided by the median household income below. A ratio is comparable across currencies; the dollars are not. | 12.6× | 4.2× | San Antonio |
| Property tax on the benchmark home The effective rate on market value, which is what the two rates have in common and what the Advantage column is decided on; the bills are in each city's own dollars. | $5,104/yr (0.476%, 2026) | $4,389/yr (1.562%, 2025) | Kelowna |
| Transfer tax on the benchmark home Compared as a share of the price. Where the seller pays it, it is a cost of leaving rather than arriving. | $19,448 (buyer pays) | None | San Antonio |
| Rent control A cap protects a sitting tenant and does nothing for the next lease, so neither column is simply better. | 2.3% guideline (2026) | Forbidden by state law | Not directly comparable |
Kelowna: The 2026 Class 1 residential total of $4.7595 per $1,000 of taxable value: municipal $2.9615 plus the regional district, hospital, school, BC Assessment and MFA levies, before the Home Owner Grant, and before parcel taxes and utility user fees. San Antonio: About 1.56% of value for a homesteaded owner, worked out on the $280,999 Bexar County median sale price. A house in the City of San Antonio and Northside ISD, the school district more of the city's residents live in than any other, is taxed by seven units for 2025, which add to 2.290174 per $100 before any exemption. Each takes its own homestead exemption off the appraised value first: Northside ISD the state's $140,000 and nothing more, the county's Road and Flood Control Fund the state's $3,000 for a flood control tax and a further 20%, the Alamo Community College District 1% with the state's $5,000 floor, the San Antonio River Authority 4%, and Bexar County, University Health and the City 20% each. So Bexar County levies 0.276331 per $100 on $224,799 after an exemption of $56,200, $621; Bexar County Road and Flood Control Fund levies 0.023668 per $100 on $221,799 after an exemption of $59,200, $52; University Health levies 0.276235 per $100 on $224,799 after an exemption of $56,200, $621; City of San Antonio levies 0.54159 per $100 on $224,799 after an exemption of $56,200, $1,217; Northside ISD levies 1.0049 per $100 on $140,999 after an exemption of $140,000, $1,417; Alamo Community College District levies 0.14915 per $100 on $275,999 after an exemption of $5,000, $412; San Antonio River Authority levies 0.0183 per $100 on $269,759 after an exemption of $11,240, $49. The seven come to $4,390 a year, 1.56% of the price. Without a homestead, as a landlord or a buyer who never files, the same house owes $6,435. In San Antonio ISD, the inner-city district, the school line is 1.1552 per $100 after an exemption of $145,000, and the same house comes to $4,544, 1.62%. The median is the county's, and a typical home inside the city is cheaper: on $247,453, Zillow's August 2026 value for a typical City of San Antonio home, the Northside ISD stack comes to $3,697, 1.49%, lower because the school district's flat exemption is a larger share of a cheaper house. These are the 2025 rates, the bills due by 31 January 2026. When these figures were retrieved the Bexar County Tax Assessor-Collector's official table ran to 2025, with the units' 2026 rate calculation worksheets posted but no 2026 official rates, so the calculators stay on 2025 until all seven are published.
How safe each city is, by the numbers it publishes
Police-reported figures for the most recent year each force or statistics agency has released. Rates describe a whole city or metro area, and the spread between neighbourhoods inside one city is usually wider than the gap between the two cities.
| Measure | Kelowna | San Antonio | Advantage |
|---|---|---|---|
| Crime Severity Index Statistics Canada's weighted index for the metropolitan area, where 100 is Canada in 2006. American cities have no equivalent series. | 103.7 (2025) | Not published | Not directly comparable |
| Violent crime per 100,000 Canada counts every violent Criminal Code incident; the FBI counts four offences. The Canadian figure is always the larger one for that reason alone. | 1,872 (2025) | 532 (2025) | Not directly comparable |
| Property crime per 100,000 | 4,749 (2025) | 3,920 (2025) | Not directly comparable |
| Homicides Counts, not rates, and a single year in a small city moves a long way on chance alone. What each figure covers is under the table. | 4 (2025) | 106 (2025) | Not directly comparable |
The Kelowna CMA's Crime Severity Index has fallen four years running, from 126.03 in 2022 to 119.56 in 2023, 107.49 in 2024 and 103.68 in 2025, and its rank among CMAs dropped from second in 2022 to ninth in 2025. Most of the decline is in non-violent crime (128.98 in 2021 to 105.25 in 2025); the violent index has barely moved (104.48 to 101.94), and a May 2026 City of Kelowna citizen survey found one in four residents feel unsafe.
What the rates cover: Police-reported total violent Criminal Code violations per 100,000, Kelowna CMA, table 35-10-0177-01. 2024: 1,897.16; 2021: 1,947.46.
Homicides: Kelowna CMA homicide victims, table 35-10-0071-01, rate 1.58 per 100,000. 2024: 2 (0.80); 2023: 5 (2.04); 2022: 8 (3.36).
On the FBI's definitions, violent offenses in San Antonio went from 11,219 in 2021 to a peak of 13,105 in 2022, then 10,440 in 2023, 9,173 in 2024 and 8,241 in 2025, a 10% drop in the last year and 37% below the peak, and property offenses from 61,559 to 74,787 and a peak of 80,789 in 2023, then 70,657 and 60,693, 25% below the peak. Motor vehicle theft drove most of that swing: 8,912 in 2021, 19,090 in 2023 and 9,527 in 2025, half the peak. In 2025 the CDE shows aggravated assaults down 9% (6,037 to 5,506), robberies down 17% (1,656 to 1,380), rapes down 8% (1,354 to 1,249) and murders down 16% (126 to 106). SAPD's own January-to-November comparison points the same way: all reported crime down 13% (143,529 to 124,314), crimes against property down 18.1%, motor vehicle theft down 26.5% and robberies down 16.4%, while crimes against society rose 15.4%, which the chief put down to more drug arrests. A University of Texas at San Antonio evaluation of the city's Violent Crime Reduction Plan found violent street crime fell 22% in treated hot spots in 2024 against 9.6% citywide (San Antonio Report). The 2025 CDE counts were read on 30 September 2026 from a feed last refreshed on 15 September and can still be revised.
What the rates cover: Computed: 8,241 violent offenses (murder, rape, robbery and aggravated assault) in the FBI Crime Data Explorer's summarized data for the San Antonio Police Department (ORI TXSPD0000) in calendar 2025, divided by the 1,548,422 Vintage 2025 city population. On the CDE's own agency population of 1,549,306 the rate is also 532. No SAPD total on this definition was found in anything fetched. Its year-end report to the City Council's Public Safety Committee in December 2025 counted NIBRS crimes against persons, which include simple assaults, and put them at 28,361 for January through November 2025, down 9% from 31,179 in the same months of 2024 (KSAT).
Homicides: 106 murders and nonnegligent manslaughters in 2025 in the FBI CDE, against 126 in 2024, about 6.8 per 100,000 on the city population. SAPD's own count for January through November 2025 was 99 against 119 in the same months of 2024, a drop of nearly 17% (KSAT); a full-year SAPD figure was not found in anything fetched. The high point in the CDE series since 2021 is 233, in 2022, a year whose count includes the 53 migrants found dead in a tractor-trailer on the Southwest Side (San Antonio Report).
Winters, summers and what the weather can do to a house
| Measure | Kelowna | San Antonio | Advantage |
|---|---|---|---|
| January mean | -2.6 °C | 11.2 °C | Not directly comparable |
| July mean | 20.0 °C | 29.3 °C | Not directly comparable |
| Precipitation a year | 387 mm | 822 mm | Not directly comparable |
| Snowfall a year | 89 cm | 1 cm | Not directly comparable |
| Sunshine a year | 1,949 hours | 2,629 hours | San Antonio |
Temperatures are Environment Canada 1991-2020 normals for the composite KELOWNA station (climate ID 1123939, airport site at 49 57 N 119 22 W, 433 m). The 1991-2020 tables for that station publish precipitation only for September, so precipitation, snowfall and sunshine are the 1981-2010 normals for KELOWNA A (climate ID 1123970). Summers are dry and hot (20.0 C July mean), winters cloudy and mild for the interior.
Hazards: Wildfire and summer smoke are the defining hazard: the August 2023 McDougall Creek fire jumped Okanagan Lake, put about 35,000 people under evacuation order, destroyed or damaged 189 structures and caused about $480 million in insured losses; most summers bring days of smoke from fires elsewhere in the interior. Spring freshet flooding along Okanagan Lake and Mill Creek (2017) and heat (June 2021 heat dome) are the others.
NOAA NCEI 1991-2020 normals for San Antonio International Airport (station USW00012921), inside the city about 8 miles north of downtown and the station where the National Weather Service keeps San Antonio's official record: January mean 52.2F, July mean 84.8F, annual mean 69.6F, 32.38 in of precipitation, 0.2 in of snow. August is the warmest month at 85.5F, with a mean high of 96.0F; July's mean high is 94.9F and January's mean low is 41.0F. May (4.40 in) and September (3.88 in) are the wettest months and February (1.74 in) the driest; the little snow the normals record falls in February and December. The normals count 122.4 days a year at 90F or above, 17.7 at 100F or above and 14.0 nights at or below freezing. Converted here to 11.2 C, 29.3 C, 822 mm and 0.5 cm. That January mean is the same as Austin's at Camp Mabry and the precipitation is the least of the Texas cities this site compares, 99 mm less than Austin's and 495 mm less than Houston's. Sunshine hours are the older 1961-1990 NCDC means (2,629 hours, 60% of possible, and 105 clear days), since the 1991-2020 normals do not include sunshine.
Hazards: Flash flooding is the defining hazard. San Antonio sits on the Balcones Escarpment in what a National Weather Service meteorologist calls Flash Flood Alley, where shallow soil over limestone sends heavy rain straight into the creeks. On 17 and 18 October 1998 a nearly stationary storm complex, fed by moisture from two Eastern Pacific hurricanes, dropped 11.26 in (286 mm) on San Antonio International on the 17th, still the station's wettest calendar day, and 13.35 in (339 mm) in 24 hours, and October 1998's 18.07 in (459 mm) remains the wettest month on record there. Across South Texas that flood killed 31 people, and NOAA puts the damage at $942 million ($1.81 billion in 2024 dollars); the San Antonio Report counts 11 of the dead in San Antonio. On 25 May 2013, over Memorial Day weekend, 9.87 in (251 mm) fell at the airport, the station's second-wettest day, and a gauge on Olmos Creek caught 15.31 in in five hours and about 17 in by the end of the day; US 281 stayed under water for days, crews made more than 235 rescues and at least two people died. The deadliest single day came on 12 June 2025, when more than 7 in fell in three hours over the Beitel Creek watershed on the Northeast Side and the airport recorded a record 3.9 in (99 mm) in one hour and 6.11 in (155 mm) for the day: the creek rose by as much as a foot every ten minutes, and 13 people died, 11 of them along Beitel Creek, where at least 15 vehicles were swept off the Loop 410 frontage road. Two more were found dead after a storm flooded Salado Creek over Labor Day weekend, and over the July Fourth weekend between the two 117 people died in nearby Kerr County and 135 across the state. Heat is the constant. The normals count 122.4 days a year at or above 90F, about the same as Austin's 122.8 and more than Houston's 111.3 or Dallas's 107.5, and 17.7 at or above 100F (37.8 C), between Houston's 7.0 and Dallas's 22.4. The airport's record is 75 days of 100F in 2023, including 23 in a row from 30 July to 21 August, well ahead of 59 in 2009 and 58 in 2022, and its highest reading is 111F (43.9 C), on 5 September 2000; 2026 had 24 such days through 22 September. Cold is rare and badly handled. Winter Storm Uri left 6.2 in (15.7 cm) of snow at the airport from 14 to 18 February 2021 and a low of 9F (-12.8 C) on the 15th, the coldest there since 6F (-14.4 C) on 23 December 1989; the station's record low is 0F (-17.8 C), on 31 January 1949, and its biggest snowfall 13.2 in (33.5 cm), on 12 January 1985. ERCOT cut power across the state grid from 15 to 18 February and about 4.5 million customers lost it at the worst; Texas counted 246 deaths from the storm, 16 of them in Bexar County, and CPS Energy, the city's municipal electric and gas utility, reported $675 million to $850 million of losses on natural gas purchases and $175 million to $250 million on purchased power.
What people earn and what the government takes
| Measure | Kelowna | San Antonio | Advantage |
|---|---|---|---|
| Median household income | $85,000 CAD (2020) | $66,176 USD (2024) | Not directly comparable |
| Unemployment rate Statistics Canada and the Bureau of Labor Statistics define unemployment slightly differently; the Canadian measure runs about a point higher on the same labour market. | 9.3% (July 2026) | 4.7% (July 2026) | Not directly comparable |
| Sales tax | 12% | 8.25% | San Antonio |
| Top marginal income tax Federal plus provincial or state. The American figure leaves out payroll taxes and the cost of health insurance, both of which a Canadian household covers through the tax it pays here. | 53.5% | 37% | San Antonio |
| Income tax on $100,000, single filer Computed from each jurisdiction's brackets at a single filer's $100,000 and rounded to the dollar, so a gap of a dollar is rounding rather than tax. Two cities in one province or state are shown as Even, because there the two cells describe the same tax and whatever separates them is method. | $20,500 CAD | $13,449 USD | Not directly comparable |
Health care, retail and construction together account for about 41% of regional jobs, and tourism output reached $2.4 billion with 12,630 jobs in 2022. The Okanagan tech sector counted 787 companies and 32,645 jobs with a $4.98 billion economic impact in 2023 (Accelerate Okanagan/KPMG), but the CMA has carried the highest unemployment rate in Canada through spring and summer 2026 as the labour force has grown faster than jobs.
Main sectors: Health care and social assistance, Retail trade, Construction and real estate, Tourism and hospitality, Technology.
BC also levies a speculation and vacancy tax and an additional property transfer tax for foreign buyers in the Central Okanagan; MSP premiums were abolished in 2020, replaced by an employer health tax.
BLS counted 1,191,700 nonfarm jobs in the San Antonio-New Braunfels MSA in August 2026 (not seasonally adjusted, preliminary), up 6,100 or 0.5% on the year. Professional and business services grew fastest (+4.8%, to 162,400), then construction (+2.9%) and trade, transportation and utilities (+2.8%), while information (-7.7%), government (-3.1%, to 181,800) and private education and health services (-2.0%, to 180,300) shrank; federal government employment fell 6.7%, from 38,700 to 36,100. Trade, transportation and utilities is the largest sector at 216,300 jobs. The seasonally adjusted series (SMS48417000000000001) was 1,195,900 in August 2026, 0.8% above August 2025. BLS's federal line is far smaller than the base itself: the Texas Comptroller counts 74,713 direct employees at Joint Base San Antonio in 2025, 33,256 of them active-duty military, and estimates the base supported 223,349 Texas jobs and $33.9 billion of the state's GDP ($53.5 billion of output). Greater SATX, the regional economic development group, calls it the largest joint base in the US military. UT San Antonio, formed when UTSA and UT Health San Antonio merged in September 2025, calls health care and biosciences, a $44.1 billion sector, the city's largest industry. H-E-B, USAA, Valero Energy and iHeartMedia are all headquartered in the city.
Main sectors: Military and federal installations: Joint Base San Antonio (Fort Sam Houston with Brooke Army Medical Center, Lackland Air Force Base with the Air Force's basic military training and the 16th Air Force, and Randolph Air Force Base with the Air Education and Training Command), Health care and biosciences (the South Texas Medical Center, University Health, UT Health San Antonio and UT San Antonio, Methodist Hospital, the Audie L. Murphy Memorial Veterans Hospital), Tourism and hospitality (Visit San Antonio counts $23.4 billion of economic impact and more than 150,000 jobs in 2024), Trade, transportation and utilities, the metro's largest sector by payroll jobs (H-E-B, headquartered in the city; CPS Energy; San Antonio International Airport's cargo), Financial services, energy and media headquarters (USAA, Valero Energy, iHeartMedia).
Property tax is the local levy that matters. Tax Foundation puts Texas's effective property tax rate on owner-occupied homes at 1.40%, and school districts must exempt $140,000 of a homestead's value from their tax. On 17 September 2026 the City Council voted 7 to 4, with Mayor Gina Ortiz Jones in the minority, to raise the city's own rate for the first time since 1992, as part of a plan to close a $158 million deficit over two years that also includes cuts, fee increases and a second rate increase planned for fiscal 2028. The fiscal 2027 rate is 56.288 cents per $100 of taxable value: 35.138 cents for maintenance and operations, two cents more than before, and 21.150 cents for debt service. The two outlets that gave a figure for the average homestead disagree: KSAT put it at about $49 more a year on a taxable value of $231,356, and the San Antonio Report at $35.43 on a $234,000 home. Senior and disabled homeowners with a tax freeze, about 47% of the city's homesteads, are unaffected (KSAT). The county, school district, University Health, San Antonio River Authority, Alamo Colleges and other levies on the same bill belong to the housing layer.
Whether you need a car
| Measure | Kelowna | San Antonio | Advantage |
|---|---|---|---|
| System | Kelowna Regional Transit System (BC Transit, operated with the City of Kelowna, West Kelowna, Lake Country, Peachland and the regional district) | VIA buses on 95 routes (three Primo rapid lines, 21 frequent and 70 standard) with 511 buses and 5,984 stops, VIA Link on-demand rideshare zones and paratransit (138 vehicles), across San Antonio, 13 smaller cities and unincorporated Bexar County; there is no rail, and the Green Line, the first of two Advanced Rapid Transit bus lines, is under construction | Not directly comparable |
| Commute by public transit | 4.0% (2021) | 2.4% (2024) | Kelowna |
| Walk or cycle to work | 9.1% (2021) | 2.5% (2024) | Kelowna |
| Airport | Kelowna International Airport (YLW), city-owned; 2,315,432 passengers in 2025, up 8.5% on 2.13 million in 2024, ninth busiest airport in Canada. | San Antonio International Airport (SAT), about 8 miles north of downtown and with no airline hub, handled 10,740,694 passengers in 2025, 3.2% fewer than the record 11,094,278 of 2024, and a record 274,847,470 pounds of air cargo, up 15.7%, per the airport's year-end statistics report, which puts the passenger decline down to economic uncertainty and the federal government shutdown. The airport is building Terminal C, which it says will add more than 850,000 square feet and up to 18 domestic and international gates by mid-2028. | Not directly comparable |
6.45 million rides in 2024 (up 330,000 on 2023), forecast 6.6 million for 2025 on about 219,000 service hours; more than 15,000 additional hours started January 2026 and another 12,380 are approved for 2027.
VIA carried 30,665,700 unlinked trips in 2025 and about 105,800 a weekday in the second quarter of 2026 (APTA ridership reports, as cited by Wikipedia; APTA's PDFs refused the fetcher), against 78.0 million for Houston's METRO and 52.8 million for DART. Bexar County voters created VIA in 1977 with a half-cent sales tax, and a city-only Advanced Transportation District approved in 2004 adds more. The VIA Rapid Green Line will run along San Pedro Avenue from San Antonio International Airport through downtown to Brooks Transit Center, with dedicated bus lanes and new signal-protected crossings. It is a $481 million project, $268 million of it a federal grant the Federal Transit Administration committed in December 2024; construction began in the summer of 2025, work is active along San Pedro, and the FTA's revenue service date is April 2028. The east-west Silver Line, from the Frost Bank Center area to General McMullen Drive, is in design and projected for late 2030.
Health care, schools and what each city is like
Health care
Care is publicly funded through the BC Medical Services Plan (no premiums since 2020) and delivered by Interior Health; Kelowna General Hospital is the interior's tertiary referral hospital with cardiac surgery and cancer care on site (BC Cancer Kelowna). Access is the problem rather than cost: KGH closed its pediatric unit for at least six weeks in May 2025 and curtailed neurology in January 2026 for lack of specialists, obstetricians warned of a collapse in primary maternity coverage, and finding a family doctor typically means a long wait on the provincial Health Connect Registry.
Education
UBC Okanagan (opened 2005, now roughly 12,000 students, with a record domestic intake of more than 3,000 new students in September 2025) and Okanagan College (about 5,200 FTE students across the valley) are the post-secondary anchors. Public schooling is School District 23 Central Okanagan, one of BC's fastest-growing districts, with French immersion and a few independent schools; there is no magnet or charter system.
Living there
Kelowna is a lake-and-orchard city of about 166,000 stretched along the east shore of Okanagan Lake, with a compact downtown, sprawling hillside subdivisions and a single bridge to West Kelowna that jams every afternoon. Summers are hot and dry and built around the beach, boats and the wineries; they also come with wildfire smoke, and the 2023 McDougall Creek fire is still a fresh memory. Housing costs are high for local wages, the unemployment rate led the country in 2026, and crime severity, though falling since 2022, is still well above the national figure.
Health care
Care is paid for through employer or marketplace insurance, Medicare and Medicaid, and Texas is one of the ten states that have not expanded Medicaid under the Affordable Care Act (KFF, August 2026). It had the highest uninsured rate of any state in 2024: 16.7%, or 5,152,427 of 30,799,312 people, against 8.2% nationally and 12.0% in Georgia, the next highest, on the ACS 2024 1-year estimates. The City of San Antonio's rate was 18.0% (268,665 of 1,496,335), Bexar County's 15.8% and the metro's 14.5%. The South Texas Medical Center on the Northwest Side covers more than 900 acres around the medical school that opened there in 1968 and holds the Audie L. Murphy Memorial Veterans Medical Center and a dozen other hospitals; a UTSA study cited by the San Antonio Report in 2022 put its annual economic effect on the region at $24.5 billion. University Health, the Bexar County Hospital District, runs University Hospital there, a 716-bed teaching hospital and a Level I trauma center for adults and children, and the 300-bed Women's & Children's Hospital that opened on the same campus in 2023; it plans to open two community hospitals elsewhere in the county in 2027. Brooke Army Medical Center at Fort Sam Houston has about 8,500 staff. UT Health San Antonio, the clinical arm of UT San Antonio, counts more than 2.5 million patient visits a year. This file did not verify a wait time figure for primary or specialist care.
Education
No single school district covers the city. Northside ISD, the largest in the San Antonio area with about 98,000 students, faced a $35 million deficit in March 2026, down from nearly $108 million, and its superintendent said closures were possible but not expected for 2026-27 (KSAT). North East ISD lost about 2,000 students in 2025-26, now serves about 55,000, closed three campuses the year before and will accept students from anywhere in the region from 2026-27 (San Antonio Report). San Antonio ISD has closed 25 schools in the last decade and in March 2026 voted to close Rhodes Middle School and hand three other campuses to a charter operator, Third Future Schools, citing falling enrollment and state accountability ratings. Districts say they cannot yet tell how many students the state's new education savings accounts, which help pay private school tuition from 2026-27, will draw away. UT San Antonio, formed on 2 September 2025 when UTSA merged with UT Health San Antonio, has about 40,000 students and 17,000 employees and calls itself the third-largest public research university in Texas by research spending, and the Alamo Colleges District runs five community colleges.
Living there
San Antonio is the second city of Texas and the seventh-largest in the country, and unlike Dallas it is still growing inside its own limits: it added 14,359 residents in 2024-25, the third-largest gain of any US city, and 8.0% since 2020. The military has shaped it for three centuries, and Joint Base San Antonio, with 74,713 direct employees, sits beside the South Texas Medical Center and a tourism trade Visit San Antonio values at $23.4 billion as the pillars of the economy. Household income is lower than in Dallas or Austin, and 18.0% of residents have no health insurance. VIA runs buses only, 2.4% of workers take them and 68.2% drive alone, and the Green Line along San Pedro Avenue, the city's first rapid transit line, is due in April 2028. Summers are long and dry rather than humid, with 122 days a year at 90F or above and 75 at 100F in 2023, and water is the killer: the creeks rise within minutes, and a single night of rain on 12 June 2025 drowned 13 people. The open questions are fiscal and civic: the council raised the city's property tax rate for the first time since 1992 on a 7 to 4 vote the mayor opposed, with a second increase planned, and the big school districts are shrinking, closing campuses and competing for each other's students as the state's education savings accounts begin.
Where each city wins, and where it loses
Kelowna's figures are in Canadian dollars and San Antonio's in US dollars. Kelowna's single-family benchmark for the Central Okanagan was $1,072,400 CAD in July 2026, 2.3% above a year earlier. The San Antonio price is the San Antonio Board of REALTORS' median sale price for Bexar County, $280,999 USD in August 2026, 3.1% below a year earlier; it is the county's figure, because no city-level median could be retrieved, and a median across every home sold, and Zillow's single-family value for the City of San Antonio was $249,206. Held against pay, Kelowna's house is 12.6 times the metro's 2020 median household income of $85,000 CAD and the Bexar County median about 4.2 times the City of San Antonio's 2024 median of $66,176 USD. At 20% down, Kelowna's mortgage at 4.34% is $4,672 CAD a month over 25 years, and San Antonio's $224,799 loan at Freddie Mac's 7.03% of 24 September 2026 about $1,500 USD over 30. Property tax is 0.48% of price in Kelowna, $5,104 CAD a year, against $4,390 USD from seven taxing units on a Bexar County address in the City and Northside ISD, an effective 1.56% with a homestead and $6,435 without. With insurance at $165 CAD and $250 USD a month, the San Antonio figure buying no flood cover, the owners carry about $5,262 CAD and $2,116 USD, roughly 74% and 38% of local median income. A two-bedroom averaged $2,132 CAD in October 2025, about 30% of local median income, and San Antonio's median two-bedroom rent was $1,179 USD in September 2026, about 21%. Only British Columbia caps the increase on an existing tenancy, at 2.3% for 2026.
Homicide is the one count that crosses the border intact, and it favors Kelowna, with a caveat about territory: Kelowna's figures cover the metro and San Antonio's the city of 1,548,422. The Kelowna metro recorded 4 homicide victims in 2025, 1.58 per 100,000. San Antonio recorded 106 in the FBI's file, about 6.8 per 100,000, against 126 in 2024, and its police department counted 99 in January through November. The other rates are different instruments. Statistics Canada put the Kelowna metro's 2025 Crime Severity Index at 103.68 against a national 75.0, ninth highest of 41 metros; American cities have no equivalent. Kelowna's violent rate of 1,872 per 100,000 counts every violent Criminal Code violation, common assault and uttering threats included. San Antonio's 532 is 8,241 offenses of murder, rape, robbery and aggravated assault, divided by the Census estimate, because no San Antonio Police Department total on those definitions was found. Property crime, 4,749 per 100,000 against 3,920, is defined differently too. Kelowna's index has dropped four years running from 126.03 in 2022, though a May 2026 city survey found one resident in four feels unsafe, and San Antonio's violent offenses dropped 10% in 2025 and stood 37% below their 2022 peak. The San Antonio counts, read on 30 September 2026, can still be revised.
San Antonio has the mild winter and Kelowna the mild, dry summer. January averages 11.2 C at San Antonio International and -2.6 C at Kelowna's airport; July averages 29.3 C in San Antonio, where August is warmer still, against 20.0 C in Kelowna. San Antonio gets 822 mm of precipitation a year and 0.5 cm of snow, Kelowna 386.9 mm and 89 cm on its 1981-2010 normals, so San Antonio is about twice as wet, and it is sunnier on the older series, 2,629 hours against 1,948.9. San Antonio's normals count 122.4 days a year at or above 32.2 C (90F) and 17.7 at or above 37.8 C (100F), and 2023 brought 75 days of 100F. The two cities' defining hazards are opposites. Kelowna's is fire: the August 2023 McDougall Creek fire jumped Okanagan Lake, put about 35,000 people under evacuation order and caused about $480 million in insured losses, and most summers bring days of smoke. San Antonio's is water. It sits on the Balcones Escarpment, where rain runs off shallow soil into the creeks within minutes, and on 12 June 2025 a storm on the Northeast Side drowned 13 people, most of them in vehicles swept off a Loop 410 frontage road into Beitel Creek. Cold is rare and badly handled: Winter Storm Uri brought 9F (-12.8 C) to the airport in February 2021 while ERCOT cut power across the state grid, and Bexar County counted 16 of the state's 246 deaths.
The labor markets are in opposite condition. The Kelowna metro's unemployment rate was 9.3% in July 2026 on a three-month average, the highest of any Canadian metro for a fourth straight month. Its labor force has grown faster than its employers hire, in a market where health care, retail and construction are about 41% of regional jobs. The San Antonio metro's rate was 4.7%, not seasonally adjusted and preliminary; the two are built differently, but the gap is too wide for that to close it. The San Antonio metro counted 1,191,700 nonfarm jobs in August 2026, 0.5% more than a year earlier. Joint Base San Antonio, which is Fort Sam Houston, Lackland and Randolph, had 74,713 direct employees in 2025, UT San Antonio calls health care and biosciences a $44.1 billion sector, and H-E-B, USAA, Valero Energy and iHeartMedia are headquartered in the city. Median household income was $85,000 CAD in the Kelowna metro in 2020 and $66,176 USD in the City of San Antonio in 2024, $78,112 across its metro. British Columbia levies a provincial income tax, so $100,000 pays about $20,500 CAD before about $4,900 of CPP and EI, with a top combined rate of 53.5% and 12% on purchases. Texas levies none, so the same salary pays $13,449 USD in federal tax for 2025; the top rate is the federal 37% and sales tax is 8.25%. Property tax carries the load instead, $4,390 a year on the Bexar County median against $5,104 CAD on Kelowna's benchmark.
Neither city lets most households give up the car, and Kelowna's commuters use the alternatives a little more. In the 2021 census 4.0% of Kelowna commuters took transit and 9.1% walked or cycled, counted in a pandemic year, and 84.3% went by car, truck or van. In San Antonio in 2024, 2.4% took transit, all of them by bus, 2.5% walked or cycled, 68.2% drove alone and 11.1% worked from home. The Kelowna Regional Transit System carried 6.45 million rides in 2024 on about 219,000 service hours. VIA carried 30,665,700 trips in 2025 on 95 bus routes, three of them Primo rapid lines, with no rail. Its first rapid transit line, the $481 million Green Line, is a bus route with dedicated lanes along San Pedro Avenue from the airport through downtown to Brooks Transit Center, under construction since the summer of 2025 and due in April 2028. Kelowna's choke point is the single bridge to West Kelowna, which jams every afternoon. Flying favors San Antonio: San Antonio International, which is no airline's hub, handled 10,740,694 passengers in 2025, 3.2% fewer than in 2024, against 2,315,432 at YLW, and it is building a Terminal C due by mid-2028.
Health care is where the border shows most. In Kelowna, BC's Medical Services Plan pays for physician and hospital care with nothing due at the point of use and has charged no premiums since 2020, and Kelowna General is the interior's tertiary referral hospital. Access is the problem: the pediatric unit closed for at least six weeks in May 2025, neurology was curtailed in January 2026, and a family doctor means a wait on the Health Connect Registry. In San Antonio care is bought through an employer or marketplace plan, Medicare or Medicaid, and Texas is one of ten states that have not expanded Medicaid. It had the highest uninsured rate of any state in 2024, 16.7%, and the City of San Antonio's was 18.0%. University Health, the county's hospital district, runs University Hospital in the South Texas Medical Center, a 716-bed teaching hospital and a Level I trauma center for adults and children, and Brooke Army Medical Center at Fort Sam Houston has about 8,500 staff. This site verified no wait time for either city. Kelowna's schools are School District 23 Central Okanagan, with French immersion and no magnet or charter system. No single district covers San Antonio: Northside ISD, the largest, with about 98,000 students, faced a $35 million deficit in March 2026, San Antonio ISD has closed 25 schools in a decade, and the state's education savings accounts begin paying toward private tuition in 2026-27.
What people underestimate is that the two places are moving in opposite directions, and what the San Antonio figure leaves out. Kelowna was estimated at 166,278 people in July 2026, against 167,659 a year earlier, its first annual decline since at least 2001, yet its single-family benchmark stood 2.3% above a year before. With nearly one worker in ten out of work, that price is being paid with income or equity from elsewhere. San Antonio added 14,359 residents in 2024-25, the third-largest gain of any US city, and the Bexar County median stood 3.1% below a year before. A Kelowna buyer pays $19,448 CAD in BC property transfer tax on the benchmark, and Texas has no transfer tax. But the San Antonio carry buys no flood insurance, which a homeowners policy does not include, and its $4,390 assumes a filed homestead in the City and Northside ISD at 2025 rates. A San Antonio mailing address may be outside the city, in one of 24 special improvement districts the county has created in the City's extraterritorial jurisdiction, 22 of them levying 0.54159 per $100, the same as the City's own rate, and on 17 September 2026 the City Council voted to raise the city's own rate for the first time since 1992. Kelowna's 4.34% renews after a five-year term, while the San Antonio 7.03% holds for thirty years; at 6.67%, the August rate Charlotte and the Florida cities on this site were written at, the carry would be about $2,062.
Better here
- There were 4 homicides in the metro in 2025, about 1.58 per 100,000, against 106 in San Antonio at about 6.8.
- BC's Medical Services Plan covers physician and hospital care with nothing due at the point of use and has charged no premiums since 2020, where 18.0% of San Antonio residents had no health insurance in 2024.
- July averages 20.0 C and dry on the 1991-2020 normals, against 29.3 C at San Antonio International, where the same normals count 122.4 days a year at or above 32.2 C (90F).
- Its flood hazard is the spring freshet along Okanagan Lake and Mill Creek, as in 2017, not the flash floods that drowned 13 people in one San Antonio storm in June 2025.
- A two-bedroom averaged $2,132 CAD in October 2025 on a 6.9% vacancy rate, and BC caps increases on an existing tenancy at 2.3% for 2026, where Texas forbids rent control by statute outside a declared disaster.
- Transit carried 4.0% of city commuters in the 2021 census and 9.1% walked or cycled, against 2.4% and 2.5% in San Antonio in 2024.
Worse here
- Metro unemployment was 9.3% in July 2026, the highest of any Canadian metro for a fourth straight month, against 4.7% in the San Antonio metro on an unadjusted count.
- The single-family benchmark of $1,072,400 CAD in July 2026 is 12.6 times the metro's 2020 median household income, against about 4.2 times for the Bexar County median.
- Mortgage, property tax and insurance come to about $5,262 CAD a month on the benchmark, roughly 74% of the 2020 metro median, and the buyer pays $19,448 in property transfer tax at closing.
- The August 2023 McDougall Creek fire put about 35,000 people under evacuation order and caused about $480 million in insured losses, and smoke arrives most summers.
- Income tax on $100,000 is about $20,500 CAD for 2025 against $13,449 USD of federal tax in San Antonio, sales tax is 12% against 8.25%, and the top combined rate is 53.5% against 37%.
- YLW handled 2,315,432 passengers in 2025, against 10,740,694 at San Antonio International, and most long trips from Kelowna connect through Vancouver or Calgary.
Choose Kelowna if
- you already earn in Canadian dollars, or carry remote income or a pension, and do not need a local employer
- you want a dry 20.0 C July on a lake rather than 122 days a year at 90F or more
- you want health coverage that comes with residency rather than with an employer, a premium or a deductible
- you plan to rent for a while and want a loose market with a legal cap on increases
The Kelowna guide · Neighbourhoods · Kelowna rent vs buy · Kelowna mortgage calculator
Better here
- Metro unemployment was 4.7% in July 2026, not seasonally adjusted, against 9.3% in the Kelowna metro, on 1,191,700 nonfarm jobs in August.
- The Bexar County median of $280,999 USD in August 2026 is about 4.2 times the city's 2024 median household income, against 12.6 times for Kelowna's benchmark house.
- Mortgage, property tax and insurance come to about $2,116 USD a month on that county median, roughly 38% of local median income against about 74% in Kelowna, and Texas charges no transfer tax.
- Texas levies no income tax, so $100,000 pays $13,449 USD in federal tax for 2025 and $13,170 for 2026, against about $20,500 CAD in Kelowna.
- January averages 11.2 C with 0.5 cm of snow a year on the 1991-2020 normals, against -2.6 C in Kelowna and 89 cm of snow on its 1981-2010 normals.
- San Antonio International handled 10,740,694 passengers in 2025, more than four times YLW's 2,315,432, and a Terminal C is due by mid-2028.
Worse here
- There were 106 homicides in 2025, about 6.8 per 100,000, against 4 and about 1.58 in the Kelowna metro.
- Property tax on the county median is $4,390 a year for the 2025 tax year with a homestead, an effective 1.56%, and $6,435 without one, against 0.48% of price in Kelowna, and the City Council voted in September 2026 to raise the city's rate.
- Flash floods on 12 June 2025 killed 13 people, most of them in vehicles swept into Beitel Creek, and a homeowners policy does not cover rising water.
- Texas had the highest uninsured rate of any state in 2024, 16.7%, the City of San Antonio's was 18.0%, and in August 2026 Texas was one of ten states that have not expanded Medicaid.
- Only 2.4% of workers commuted by transit in 2024 and 68.2% drove alone, and VIA runs no rail.
- The normals count 17.7 days a year at or above 37.8 C (100F), and 2023 brought 75 of them.
Choose San Antonio if
- you need to find work locally and want a 4.7% unemployment rate behind you rather than 9.3%
- you want a house at about four times what households around you earn, bought on a salary rather than on equity
- you want an 11.2 C January and can plan a summer around the heat
- you have employer health insurance you trust and would rather pay property tax on a house than provincial income tax on a salary
The San Antonio guide · Neighborhoods · San Antonio rent vs buy · San Antonio mortgage calculator
Kelowna or San Antonio, in short
Is Kelowna or San Antonio cheaper to live in?
San Antonio, once each bill is held against its own city's pay, because the currencies do not convert here. A Kelowna owner pays about $5,262 CAD a month on mortgage, property tax and insurance, roughly 74% of the metro's 2020 median household income of $85,000 CAD, on a single-family benchmark 12.6 times that income. A San Antonio owner pays about $2,116 USD on the Bexar County median of $280,999, roughly 38% of the City of San Antonio's 2024 median of $66,176 USD, despite a 7.03% mortgage rate against 4.34% and a property tax bill of $4,390 a year; the price is the county's and the income the city's, Zillow's index for the City of San Antonio stood lower, at $247,453, and no flood policy is in the figure. Renting also favors San Antonio: a two-bedroom averaged $2,132 CAD in Kelowna in October 2025 on a 6.9% vacancy rate and had a median of $1,179 USD in San Antonio in September 2026, about 30% and 21% of each city's median household income. The Kelowna buyer also pays $19,448 CAD in property transfer tax at closing, and its income tax is heavier, about $20,500 CAD on $100,000 against $13,449 USD, with 12% sales tax against 8.25%.
Is Kelowna or San Antonio safer?
Kelowna on homicide, the one count that crosses the border, with the caveat that its figure covers the metro and San Antonio's the city. The Kelowna metro recorded 4 homicide victims in 2025, about 1.58 per 100,000; San Antonio recorded 106 in the FBI's file, about 6.8 per 100,000, against 126 in 2024. The other rates are different instruments. Kelowna's violent rate of 1,872 per 100,000 counts common assault and uttering threats, while San Antonio's 532 is offenses of murder, rape, robbery and aggravated assault, divided by the Census estimate and still open to revision. Property crime, 4,749 per 100,000 against 3,920, is defined differently as well. Statistics Canada put the Kelowna metro's Crime Severity Index at 103.68 in 2025, ninth highest of 41 metros and above the national 75.0, though it has dropped four years running; American cities have no equivalent. San Antonio's violent offenses dropped 10% in 2025.
Which has the better climate, Kelowna or San Antonio?
San Antonio has the easier winter and Kelowna the easier summer. January averages 11.2 C in San Antonio with 0.5 cm of snow a year, against -2.6 C in Kelowna and 89 cm on its 1981-2010 normals. July reverses it: 29.3 C at San Antonio International, with 122.4 days a year at or above 32.2 C (90F) on the normals, against 20.0 C and dry in Kelowna. San Antonio is about twice as wet, 822 mm a year against 386.9 mm, and sunnier on older records, 2,629 hours against 1,948.9. The hazards are opposites. Kelowna gets wildfire and smoke, and in August 2023 a fire jumped Okanagan Lake and put about 35,000 people under evacuation order. San Antonio gets flash floods, which drowned 13 people in one storm in June 2025, long runs of 100F heat and the rare hard freeze, like February 2021, when ERCOT cut power across the state grid.
What happens to my health care if I move from Kelowna to San Antonio?
Coverage stops coming with residency and starts coming with a job or a purchase. In Kelowna, BC's Medical Services Plan pays for physician and hospital care with nothing due at the point of use and no premium since 2020, and the problem is access: Kelowna General closed its pediatric unit for at least six weeks in May 2025, curtailed neurology in January 2026 for lack of specialists, and a family doctor usually means a wait on the Health Connect Registry. In San Antonio you need an employer or marketplace plan, Medicare or Medicaid, with the premium, deductible and copay that come with it. Texas is one of the ten states that have not expanded Medicaid and had the highest uninsured rate of any state in 2024, 16.7%; the City of San Antonio's was 18.0%. For the insured, University Health's University Hospital in the South Texas Medical Center is a 716-bed teaching hospital and a Level I trauma center for adults and children, and UT Health San Antonio counts more than 2.5 million patient visits a year. This site verified no wait time figure for either city.
Where the figures come from
Housing figures are the ones behind each city's calculators, dated on those pages. The rest are listed here with the date they were retrieved. See the methodology for how facts, estimates and opinion are kept apart.
- Census Profile, 2021 Census of Population: Kelowna, City (CY) and Kelowna (CMA), British Columbia (CSV download) · Statistics Canada · retrieved Supports: population.city (2021 count), Metro population, Five-year growth, Median household income, Transit commute share, Walk and cycle commute share
- Kelowna is now a shrinking city · Kelowna Daily Courier (citing BC Stats) · retrieved Supports: City population
- Table 35-10-0026-01 Crime severity index and weighted clearance rates, Canada, provinces, territories and Census Metropolitan Areas · Statistics Canada · retrieved Supports: Crime Severity Index, Crime trend
- Table 35-10-0177-01 Incident-based crime statistics, by detailed violations, Canada, provinces, territories, Census Metropolitan Areas and Canadian Forces Military Police · Statistics Canada · retrieved Supports: Violent crime rate, Property crime rate
- Table 35-10-0071-01 Number and rate of homicide victims, by Census Metropolitan Areas · Statistics Canada · retrieved Supports: Homicides
- Police-reported Crime Severity Index and crime rate, by census metropolitan area, 2025 (The Daily, table 4) · Statistics Canada · retrieved Supports: Crime Severity Index, Crime trend
- Crime falls in Metro Kelowna, but region still ranks 9th highest in Canada · Castanet · retrieved Supports: Crime trend
- Crime on the decline in Kelowna: Statistics Canada · Kelowna Capital News · retrieved Supports: Crime trend
- Canadian Climate Normals 1991-2020: KELOWNA (climate ID 1123939) · Environment and Climate Change Canada · retrieved Supports: January mean, July mean
- Canadian Climate Normals 1981-2010: KELOWNA A (climate ID 1123970) · Environment and Climate Change Canada · retrieved Supports: Annual precipitation, Annual snowfall, Sunshine hours
- August 2023: McDougall Creek wildfire causes devastation in West Kelowna · Kelowna Capital News · retrieved Supports: Climate hazards
- Kelowna's unemployment rate climbs for fifth straight month, worst in Canada · Kelowna Capital News · retrieved Supports: Unemployment rate
- Labour Force Survey, July 2026 · Statistics Canada, The Daily · retrieved Supports: Unemployment rate
- Okanagan Tech Sector Economic Impact Hits $4.98 Billion · Accelerate Okanagan · retrieved Supports: Main sectors, Labour market
- Economic profile: Kelowna, British Columbia · Immigration, Refugees and Citizenship Canada · retrieved Supports: Main sectors, Labour market
- BC 2026 & 2025 Tax Rates & Tax Brackets · TaxTips.ca · retrieved Supports: Top marginal income tax, Income tax on $100,000
- Transit service hours continue to increase as Kelowna sees record ridership · Castanet · retrieved Supports: Transit ridership
- Kelowna International Airport (YLW): Winter 2025/2026 Update · Tourism Kelowna · retrieved Supports: Airport passengers
- Kelowna International Airport welcomed 2.3 million passengers in 2025 · City of Kelowna · retrieved Supports: Airport passengers
- Pediatric unit at Kelowna hospital to close for at least 6 weeks amid doctor shortage · CBC News · retrieved Supports: Health care
- Kelowna General Hospital doctors warn of 'collapse' of primary maternity care coverage · CBC News · retrieved Supports: Health care
- UBC Okanagan kicks off milestone year with record domestic enrolment · UBC Okanagan News · retrieved Supports: Education
- Annual Estimates of the Resident Population for Incorporated Places in Texas: April 1, 2020 to July 1, 2025 (SUB-EST2025) · US Census Bureau · retrieved Supports: City population, Five-year growth, Violent crime rate, Property crime rate, Homicides, Character
- Annual Estimates of the Resident Population for Incorporated Places of 50,000 or More (all states, SUB-EST2025) · US Census Bureau · retrieved Supports: City population, Character
- Annual Resident Population Estimates and Components of Change for Metropolitan and Micropolitan Statistical Areas and Their Counties: April 1, 2020 to July 1, 2025 (CBSA-EST2025-ALLDATA) · US Census Bureau · retrieved Supports: Metro population, Five-year growth
- Crime Data Explorer summarized agency data, San Antonio Police Department (TXSPD0000): violent crime, property crime, homicide, rape, robbery, aggravated assault, burglary, larceny, motor vehicle theft and arson, 2021-2025 · FBI · retrieved Supports: Violent crime rate, Property crime rate, Homicides, Crime trend
- Crime in San Antonio dropped 13% in 2025, SAPD report says · KSAT · retrieved Supports: Violent crime rate, Homicides, Crime trend
- San Antonio sees 20% drop in homicides in 2025, new report shows · San Antonio Report · retrieved Supports: Homicides, Crime trend
- US Climate Normals 1991-2020, station USW00012921 San Antonio International Airport (Access Data Service) · NOAA National Centers for Environmental Information · retrieved Supports: January mean, July mean, Annual precipitation, Annual snowfall, Climate normals, Climate hazards, Character, January 52.2F, July 84.8F and August 85.5F from the monthly series, and annual mean 69.6F, precipitation 32.38 in, snowfall 0.2 in and the counts of days at 90F and 100F and nights at freezing from dataset=normals-annualseasonal-1991-2020 for the same station
- Global Historical Climatology Network daily summaries, San Antonio International Airport (USW00012921), 1946-2026 · NOAA National Centers for Environmental Information · retrieved Supports: Climate hazards, Character, 11.26 in on 17 October 1998, 9.87 in on 25 May 2013, 6.11 in on 12 June 2025, 75 days at or above 100F in 2023 and 23 in a row from 30 July to 21 August 2023, 59 in 2009, 58 in 2022, 24 in 2026 through 22 September, 111F on 5 September 2000, 6.2 in of snow from 14 to 18 February 2021 and 9F on 15 February 2021, 6F on 23 December 1989, 0F on 31 January 1949, 13.2 in of snow on 12 January 1985
- October 1998 Flood Event (South Central Texas) · National Weather Service, Austin/San Antonio · retrieved Supports: Climate hazards
- Average Annual Sunshine in US Cities · Current Results (NCDC Comparative Climatic Data, 1961-1990) · retrieved Supports: Sunshine hours, Climate normals
- Weather and Climate Billion-Dollar Disasters to affect the U.S. from 1980-2024 (events list) · NOAA National Centers for Environmental Information · retrieved Supports: Climate hazards
- October 1998 Central Texas floods · Wikipedia · retrieved Supports: Climate hazards
- 12 years ago, San Antonio's Highway 281 was submerged by record flooding during Memorial Day weekend · KSAT · retrieved Supports: Climate hazards
- Texas flash floods kill 2 in San Antonio · CBS News · retrieved Supports: Climate hazards
- It's San Antonio's deadliest flood year in 27 years. What's going on? · San Antonio Report · retrieved Supports: Climate hazards, Character
- February 2021 Winter Storm-Related Deaths, Texas (mortality surveillance report) · Texas Department of State Health Services · retrieved Supports: Climate hazards
- The Timeline and Events of the February 2021 Texas Electric Grid Blackouts · The University of Texas at Austin Energy Institute · retrieved Supports: Climate hazards, Main sectors
- ACS 2024 1-year tables B08301 and B19013 for San Antonio city and the San Antonio-New Braunfels MSA · Census Reporter API (US Census Bureau ACS) · retrieved Supports: Median household income, Transit commute share, Walk and cycle commute share, Character
- ACS 2024 1-year table B27001 (health insurance coverage) for the 50 states, DC, the US, Bexar County, San Antonio city and the San Antonio-New Braunfels MSA · Census Reporter API (US Census Bureau ACS) · retrieved Supports: Health care, Character
- Local Area Unemployment Statistics, San Antonio-New Braunfels, TX MSA (LAUMT484170000000003), Bexar County, the Houston, Dallas-Fort Worth and Austin MSAs, and the US rate (LNU04000000), not seasonally adjusted · US Bureau of Labor Statistics · retrieved Supports: Unemployment rate
- Current Employment Statistics, San Antonio-New Braunfels, TX MSA: total nonfarm (SMU48417000000000001, SMS48417000000000001) and supersectors (SMU484170xx00000001) · US Bureau of Labor Statistics · retrieved Supports: Main sectors, Labour market
- Joint Base San Antonio (Texas military installations economic impact, 2025) · Texas Comptroller of Public Accounts · retrieved Supports: Main sectors, Labour market, Health care, Character
- Why SATX (Joint Base San Antonio, Military City USA) · Greater SATX Regional Economic Partnership · retrieved Supports: Main sectors, Labour market
- Visit San Antonio celebrates National Travel and Tourism Week 2026 · Visit San Antonio · retrieved Supports: Main sectors, Character
- UTSA and UT Health San Antonio complete merger to become The University of Texas at San Antonio · UT San Antonio · retrieved Supports: Main sectors, Labour market, Health care, Education
- USAA (headquarters) · Wikipedia · retrieved Supports: Main sectors, Labour market
- H-E-B (headquarters) · Wikipedia · retrieved Supports: Main sectors, Labour market
- Valero Energy (headquarters) · Wikipedia · retrieved Supports: Main sectors, Labour market
- iHeartMedia (headquarters) · Wikipedia · retrieved Supports: Main sectors, Labour market
- City Sales and Use Tax (city rate table) · Texas Comptroller of Public Accounts · retrieved Supports: Sales tax
- Transit Sales and Use Tax (San Antonio MTA, effective January 1, 1978; San Antonio ATD, effective April 1, 2005, raised January 1, 2026) · Texas Comptroller of Public Accounts · retrieved Supports: Sales tax, Transit system, Transit ridership
- City's proposed plan: Collect sales tax for 4 years before revenue goes to VIA · San Antonio Report · retrieved Supports: Sales tax
- Texas Tax Rates & Rankings · Tax Foundation · retrieved Supports: Top marginal income tax, Income tax on $100,000, Tax notes
- 2025 Tax Brackets and Federal Income Tax Rates · Tax Foundation · retrieved Supports: Top marginal income tax, Income tax on $100,000
- 2026 Tax Brackets and Federal Income Tax Rates · Tax Foundation · retrieved Supports: Top marginal income tax, Income tax on $100,000
- Property Tax Exemptions · Texas Comptroller of Public Accounts · retrieved Supports: Tax notes
- San Antonio approves first property tax hike in 34 years · KSAT · retrieved Supports: Tax notes, Character
- San Antonio council passes FY 2027 budget with higher property tax revenue and fees · News 4 San Antonio · retrieved Supports: Tax notes
- San Antonio approves first tax increase in more than 30 years · San Antonio Report · retrieved Supports: Tax notes, Character
- VIA Metropolitan Transit (routes, fleet, stops, history, Green and Silver lines) · Wikipedia · retrieved Supports: Transit system, Transit ridership
- Template:American transit ridership (APTA Transit Ridership Reports, Q4 2025 and Q2 2026) · Wikipedia · retrieved Supports: Transit ridership
- Construction Updates, VIA Rapid Green Line · VIA Metropolitan Transit (Keep SA Moving) · retrieved Supports: Transit system, Transit ridership, Character
- When will San Pedro construction be complete? Here's what VIA says about progress on the Green Line. · KSAT · retrieved Supports: Transit ridership, Character
- San Antonio locks down federal funding for $480M Green Line · San Antonio Report · retrieved Supports: Transit ridership, Sales tax
- December & Year End 2025 Statistics · San Antonio International Airport · retrieved Supports: Airport passengers
- December 2024 Statistics (2024 passenger record) · San Antonio International Airport · retrieved Supports: Airport passengers
- Terminal Development Program (ELEVATE/SAT) · San Antonio International Airport · retrieved Supports: Airport passengers
- San Antonio International Airport (location, airlines, 2025 statistics) · Wikipedia · retrieved Supports: Airport passengers, Climate normals
- Status of State Medicaid Expansion Decisions · KFF · retrieved Supports: Health care
- San Antonio Medical Foundation marks 75th anniversary · San Antonio Report · retrieved Supports: Health care, Main sectors
- About Us · University Health · retrieved Supports: Health care
- University Hospital · University Health · retrieved Supports: Health care
- University Health (University Hospital beds, Women's & Children's Hospital) · Wikipedia · retrieved Supports: Health care
- Northside ISD faces $35 million deficit, but does not anticipate layoffs · KSAT · retrieved Supports: Education
- Like other San Antonio districts, NEISD drops its boundaries · San Antonio Report · retrieved Supports: Education, Character
- San Antonio ISD cites declining enrollment, poor academics for school closure · KSAT · retrieved Supports: Education, Character
- Alamo Colleges District (five colleges) · Wikipedia · retrieved Supports: Education
- July 2026 statistics: Association of Interior REALTORS® monthly news release · Association of Interior REALTORS® · retrieved Supports: Central Okanagan single-family benchmark of $1,072,400, up about 2.3% year over year, Central Okanagan townhouse benchmark of $709,500, down 2.4% year over year, Central Okanagan condominium benchmark of $490,700, down 2.0% year over year, 1,496 residential sales and 9,630 active listings across the association's region in July 2026
- Rental Market Survey: Kelowna (CY), average rent and vacancy by bedroom type, October 2025 · Canada Mortgage and Housing Corporation · retrieved Supports: City of Kelowna one-bedroom average rent of $1,600 with a 9.1% vacancy rate, City of Kelowna two-bedroom average rent of $2,132 with a 5.5% vacancy rate, City of Kelowna three-bedroom-plus average rent of $2,780, City of Kelowna overall purpose-built vacancy rate of 6.9% across 9,159 units, Kelowna CMA vacancy rate of 6.3%, and 7.5% in the Rutland survey zone
- Schedule 702: 2026 tax rates by municipality and property class · Province of British Columbia, Ministry of Municipal Affairs · retrieved Supports: Kelowna's 2026 Class 1 residential total rate of $4.7595 per $1,000 of taxable value, The municipal share of $2.9615, the school levy of $1.3110, the regional district levy of $0.2437 and the hospital levy of $0.2050
- Home owner grant · Province of British Columbia · retrieved Supports: The grant of up to $770 on an eligible principal residence outside the northern and rural area
- Premium information for homeowner and small rental loans · Canada Mortgage and Housing Corporation · retrieved Supports: Mortgage default insurance premium rates by loan-to-value
- Regulations amending the Insurable Housing Loan Regulations and the Eligible Mortgage Loan Regulations (SOR/2025-55) · Canada Gazette, Part II · retrieved Supports: The $1.5 million insured price cap, 30-year amortization for first-time buyers and new builds
- Minimum qualifying rate for uninsured mortgages · Office of the Superintendent of Financial Institutions · retrieved Supports: The qualifying rate of the contract rate plus two points, or 5.25%
- Interest rates charged for new and existing lending by chartered banks · Bank of Canada · retrieved Supports: The default mortgage rate of 4.34%, uninsured five-year-plus fixed, funds advanced May 2026
- Property transfer tax · Province of British Columbia · retrieved Supports: Transfer tax brackets, First-time buyer and new build exemptions
- Rent increases · Province of British Columbia · retrieved Supports: 2026 rent increase guideline of 2.3%
- San Antonio home sales rise 4% in August as prices hold steady · San Antonio Board of REALTORS · retrieved Supports: Bexar County: 2,068 home sales in August 2026, up 8.8% on the year, at a median price of $280,999, down 3.1%, and an average of $336,979, down 2.6%, The San Antonio area MLS: 3,104 sales, up 4%, at a median of $299,275 and an average of $372,989, released 10 September 2026, The release's table: an area median of $310,000 in August 2025 and $313,995 in August 2024, although its prose calls the median unchanged on the year, 5.87 months of inventory, 16,940 active listings and an average of 82 days on the market, 5,024 active residential rental listings at an average monthly rent of $1,832, down 2%, SABOR's membership serving Atascosa, Bee, Bexar, Frio, Karnes, Kendall, La Salle, Maverick, McMullen, Medina, Uvalde, Val Verde and Wilson counties
- South Texas market report: monthly releases · San Antonio Board of REALTORS · retrieved Supports: The monthly MLS releases for January through August 2026, reporting the San Antonio area and Bexar County and no City of San Antonio figure
- Zillow Home Value Index, all homes, middle tier, smoothed and seasonally adjusted, by city · Zillow Research · retrieved Supports: A typical home value of $247,453 for the city of San Antonio (region 6915) in August 2026, $253,000 in August 2025, so a fall of 2.2% over the year
- Zillow Home Value Index, single-family and condominium series, by city · Zillow Research · retrieved Supports: A typical single-family value of $249,206 in the city of San Antonio in August 2026, against $254,823 a year earlier, down 2.2%, A typical condominium value of $167,371 in the same month, against $174,092, down 3.9%, from the condominium file at https://files.zillowstatic.com/research/public_csvs/zhvi/City_zhvi_uc_condo_tier_0.33_0.67_sm_sa_month.csv
- San Antonio Rent Report, October 2026 · Apartment List · retrieved Supports: A median rent of $957 for a one-bedroom and $1,179 for a two-bedroom in the city of San Antonio, and $1,121 across all bedroom sizes, Rents down 0.2% over September and down 4.3% over the past 12 months, against -2.1% for the state
- Apartments for rent in San Antonio, TX: average rent · Apartment List · retrieved Supports: Average listed rents of $1,069 and up for a studio, $1,141 and up for one bedroom, $1,477 and up for two, and $1,887 and up for three or more
- FY 2026 fair market rents, San Antonio-New Braunfels, TX HUD Metro FMR Area · United States Department of Housing and Urban Development · retrieved Supports: FY 2026 fair market rents of $1,177 for one bedroom, $1,426 for two and $1,830 for three, as gross rents including utilities, Housing Choice Voucher programs in the metro using Small Area Fair Market Rents set by ZIP code
- Zillow Observed Rent Index, all homes plus multifamily, smoothed, by city · Zillow Research · retrieved Supports: An observed rent index of $1,386 for the city of San Antonio in August 2026, against $1,406 a year earlier, down 1.39%
- 2025 official tax rates and exemptions · Bexar County Tax Assessor-Collector · retrieved Supports: 2025 rates per $100: Bexar County 0.276331, Road and Flood Control Fund 0.023668, Hospital District 0.276235, City of San Antonio 0.541590, Northside ISD 1.004900, San Antonio ISD 1.155200, Alamo Community College District 0.149150, San Antonio River Authority 0.018300, Homestead exemptions of $5,000 or 20% for Bexar County, the Hospital District and the City; $3,000 and 20% for the Road and Flood Control Fund; $5,000 or 1% for the college district; $5,000 or 4% for the River Authority; $140,000 for Northside ISD; $140,000 and 0.01% for San Antonio ISD, San Antonio Municipal Utility District No. 1 at 0.20, twelve emergency service districts at up to 0.10, and 24 special improvement districts, 22 of them at 0.541590, The Downtown Public Improvement District at 0.15, and 0.09 on condominiums, Official tables from 2005 to 2025 and none yet for 2026, from https://www.bexar.org/1591/Tax-Rates
- 2024 actual tax rates and 2025 actual tax rates, as of 5 December 2025 · Bexar Appraisal District · retrieved Supports: The same 2025 rates to the sixth decimal, and each unit's 2024 rate beside it: the City, the county, the Road and Flood fund, the Hospital District, the college district and Northside ISD unchanged, and the River Authority up from 0.017870, Local option homestead exemptions not less than $5,000, and the Road and Flood fund's $3,000 homestead exemption, Redbird Ranch water districts at 1.00 per $100
- 2025 tax rate calculation worksheets: City of San Antonio · Bexar County Tax Assessor-Collector · retrieved Supports: A debt rate of 0.21150 per $100 within the City's 0.54159, leaving 0.33009 for maintenance and operations, The same 0.54159 adopted for the 2024 tax year
- Valuing property: limitation on residence homestead value increases · Texas Comptroller of Public Accounts · retrieved Supports: A residence homestead's appraised value may not rise more than 10% a year once the owner has qualified in the preceding and current year
- Property tax protests and appeals · Texas Comptroller of Public Accounts · retrieved Supports: A protest deadline of 15 May or 30 days after the appraisal district mails the notice of appraised value, whichever is later
- 2020 block assignment files, Texas: unified school districts and places · United States Census Bureau · retrieved Supports: Read with the 2020 redistricting file's block populations, at https://www2.census.gov/programs-surveys/decennial/2020/data/01-Redistricting_File--PL_94-171/Texas/tx2020.pl.zip, Of the City of San Antonio's 1,434,625 residents in 2020: 468,901 in Northside ISD, 368,830 in North East ISD, 298,175 in San Antonio ISD, 59,802 in Harlandale ISD, 56,792 in Edgewood ISD and 45,376 in South San Antonio ISD, 298,175 of San Antonio ISD's 300,690 residents inside the city, and 468,901 of Northside ISD's 665,676
- 2025 Gazetteer files: places, Texas · United States Census Bureau · retrieved Supports: A land area of 498.979 square miles and a water area of 5.735 square miles for San Antonio city
- Extraterritorial Jurisdiction (ETJ) · City of San Antonio Planning Department · retrieved Supports: The ETJ as the unincorporated land within five miles of the City's boundaries and not within another city's limits or ETJ, The area in which the City may annex land, with the consent of the landowner or voter approval, Senate Bill 2038, effective 1 September 2023, establishing a petition and election process for releasing property from a city's ETJ
- ETJ planning · City of San Antonio Planning Department · retrieved Supports: Two Military Protection Areas, within five miles of Camp Bullis and the Lackland Training Annex, developed as a direct result of a 2017 state law curtailing unilateral annexation by Texas cities
- Annexation and growth management policy, adopted 31 August 2023 · City of San Antonio Planning Department · retrieved Supports: Senate Bill 6 (2017) curtailing the annexation powers of cities in counties of more than 500,000 people, such as San Antonio, and requiring landowner or voter approval, Elections called in 2018 for areas within five miles of Camp Bullis-Camp Stanley and Lackland Air Force Base-Medina Training Annex, where owners chose land use controls rather than annexation, Chapter 382 public improvement districts created by the county with the City's written consent as the most common special district request
- Public improvement districts and special districts · City of San Antonio Planning Department · retrieved Supports: Special districts in the City's ETJ, including Chapter 382 public improvement districts, also called special improvement districts, water control and improvement districts and fresh water supply districts, Districts created by the county at a landowner's request with the City's consent, conditioned through development agreements
- Our history · CPS Energy · retrieved Supports: The nation's largest public power, natural gas and electric company, serving more than 996,000 electric and 399,000 natural gas customers, $10.6 billion in revenue generated for the City of San Antonio since 1942, Acquired by the City of San Antonio on 24 October 1942
- Edwards Aquifer · San Antonio Water System · retrieved Supports: About 47%, some 154,000 acre-feet, of the water SAWS customers used in 2025 came from the Edwards Aquifer, Permitted withdrawals subject to cutbacks of zero to 44% in critical periods
- Water supplies · San Antonio Water System · retrieved Supports: In 1995 all of San Antonio's water came from the Edwards Aquifer; SAWS now manages 13 supply projects from seven sources
- Stage 3 watering rules · San Antonio Water System · retrieved Supports: Stage 3 rules in effect on 30 September 2026: landscape watering once a week, on the customer's day, from 5 to 10 a.m. and 9 p.m. to midnight
- Stormwater fee · San Antonio Water System · retrieved Supports: SAWS bills the City of San Antonio's stormwater fee on the City's behalf, Residential rates of $3.75 a month up to 2,750 square feet of impervious area, $4.94 to 4,220 square feet and $10.45 above it
- Solid waste rates and fees · City of San Antonio Solid Waste Management Department · retrieved Supports: Monthly totals of $19.76, $25.26 and $35.75 for the small, medium and large garbage cart, including the $3.00 solid waste and $2.00 parks environmental fees, The fee shown and collected on the CPS Energy bill, with no additional fee for the recycling and organics carts
- June 11 to 12, 2025 San Antonio area flood event · National Weather Service, Austin/San Antonio · retrieved Supports: 13 fatalities from flooding across the San Antonio area, 12 in the Beitel Creek basin and one in the Leon Creek basin, 15 vehicles swept into Beitel Creek from the Loop 410 frontage road near Perrin Beitel Road, 3.98 inches of rain in one hour at San Antonio International Airport, the highest hourly rate on record since 1934
- San Antonio, TX · Texas State Historical Association, Handbook of Texas · retrieved Supports: The flood of 9 and 10 September 1921, which put up to twelve feet of water downtown and killed at least fifty-one people, and the Olmos Dam and river bypass built after it
- Home, flood, wind: which policies do you need? · Texas Department of Insurance · retrieved Supports: Most home policies do not cover floods; a flood policy covers damage from rising water
- Primary Mortgage Market Survey, 24 September 2026 · Freddie Mac · retrieved Supports: A 30-year fixed-rate mortgage averaging 7.03%, up from 6.95% the week before and 6.30% a year earlier
- Texas homeowners insurance market overview · Texas Department of Insurance · retrieved Supports: A statewide average homeowners premium of $3,489 a year
- How much is homeowners insurance in San Antonio, TX? · Insure.com · retrieved Supports: An average San Antonio premium of $2,866 a year for $300,000 of dwelling cover, $100,000 of liability and a $1,000 deductible, updated 27 May 2026, An average of $2,222 a year for $200,000 of dwelling cover
- Texas homeowners insurance · NerdWallet · retrieved Supports: An average San Antonio premium of $4,565 a year for $500,000 of dwelling cover, $300,000 of liability and a $1,000 deductible, updated 20 February 2026
- Renters insurance in Texas · NerdWallet · retrieved Supports: An average San Antonio renters premium of $167 a year, $14 a month, for $30,000 of personal property, updated 23 September 2026
- Monthly homeowners' association and condominium fee, tables B25142 and B25143, 2024 American Community Survey 1-year estimates, San Antonio city · United States Census Bureau, via the Census Reporter API · retrieved Supports: A median monthly association fee of $60 among San Antonio owner-occupied units that pay one, 110,122 of 295,530 owner-occupied units, or 37.3%, paying such a fee, and 4,864 paying $500 or more a month
- Homeownership Incentive Programs (HIP) · City of San Antonio Neighborhood and Housing Services Department · retrieved Supports: HIP 80: $1,000 to $30,000 as a 0% interest, no-payment second loan, the first $15,000 forgiven over five years and the rest over ten, on an existing home up to $260,000 or a new one up to $284,000, with 2026 income limits of $56,350 for one person to $80,500 for four, HIP 120: $1,000 to $15,000, 75% forgiven over ten years and 25% perpetual, on an existing home up to $301,700 or a new one up to $332,800, with income limits of $84,500 for one person to $120,700 for four, A HUD-approved eight-hour homebuyer class, a home inside the city limits and a $500 minimum earnest money deposit
- HIP 80 and HIP 120 general information · City of San Antonio Neighborhood and Housing Services Department · retrieved Supports: Both programs for income-eligible first-time homebuyers buying a primary residence, which must pass a HIP property review and inspection, The remaining balance repaid in part on a change of ownership, a sale or a cash-out refinance, from this sheet and the HIP 120 sheet at https://www.sa.gov/files/assets/main/v/5/nhsd/documents/hip120-generalinformation.pdf