Vancouver vs Toronto: which should you move to?
Vancouver or Toronto? Housing, rent, crime, climate, income, taxes and transit, side by side, from each city's own published figures. Written for someone deciding where to live, not for a ranking.
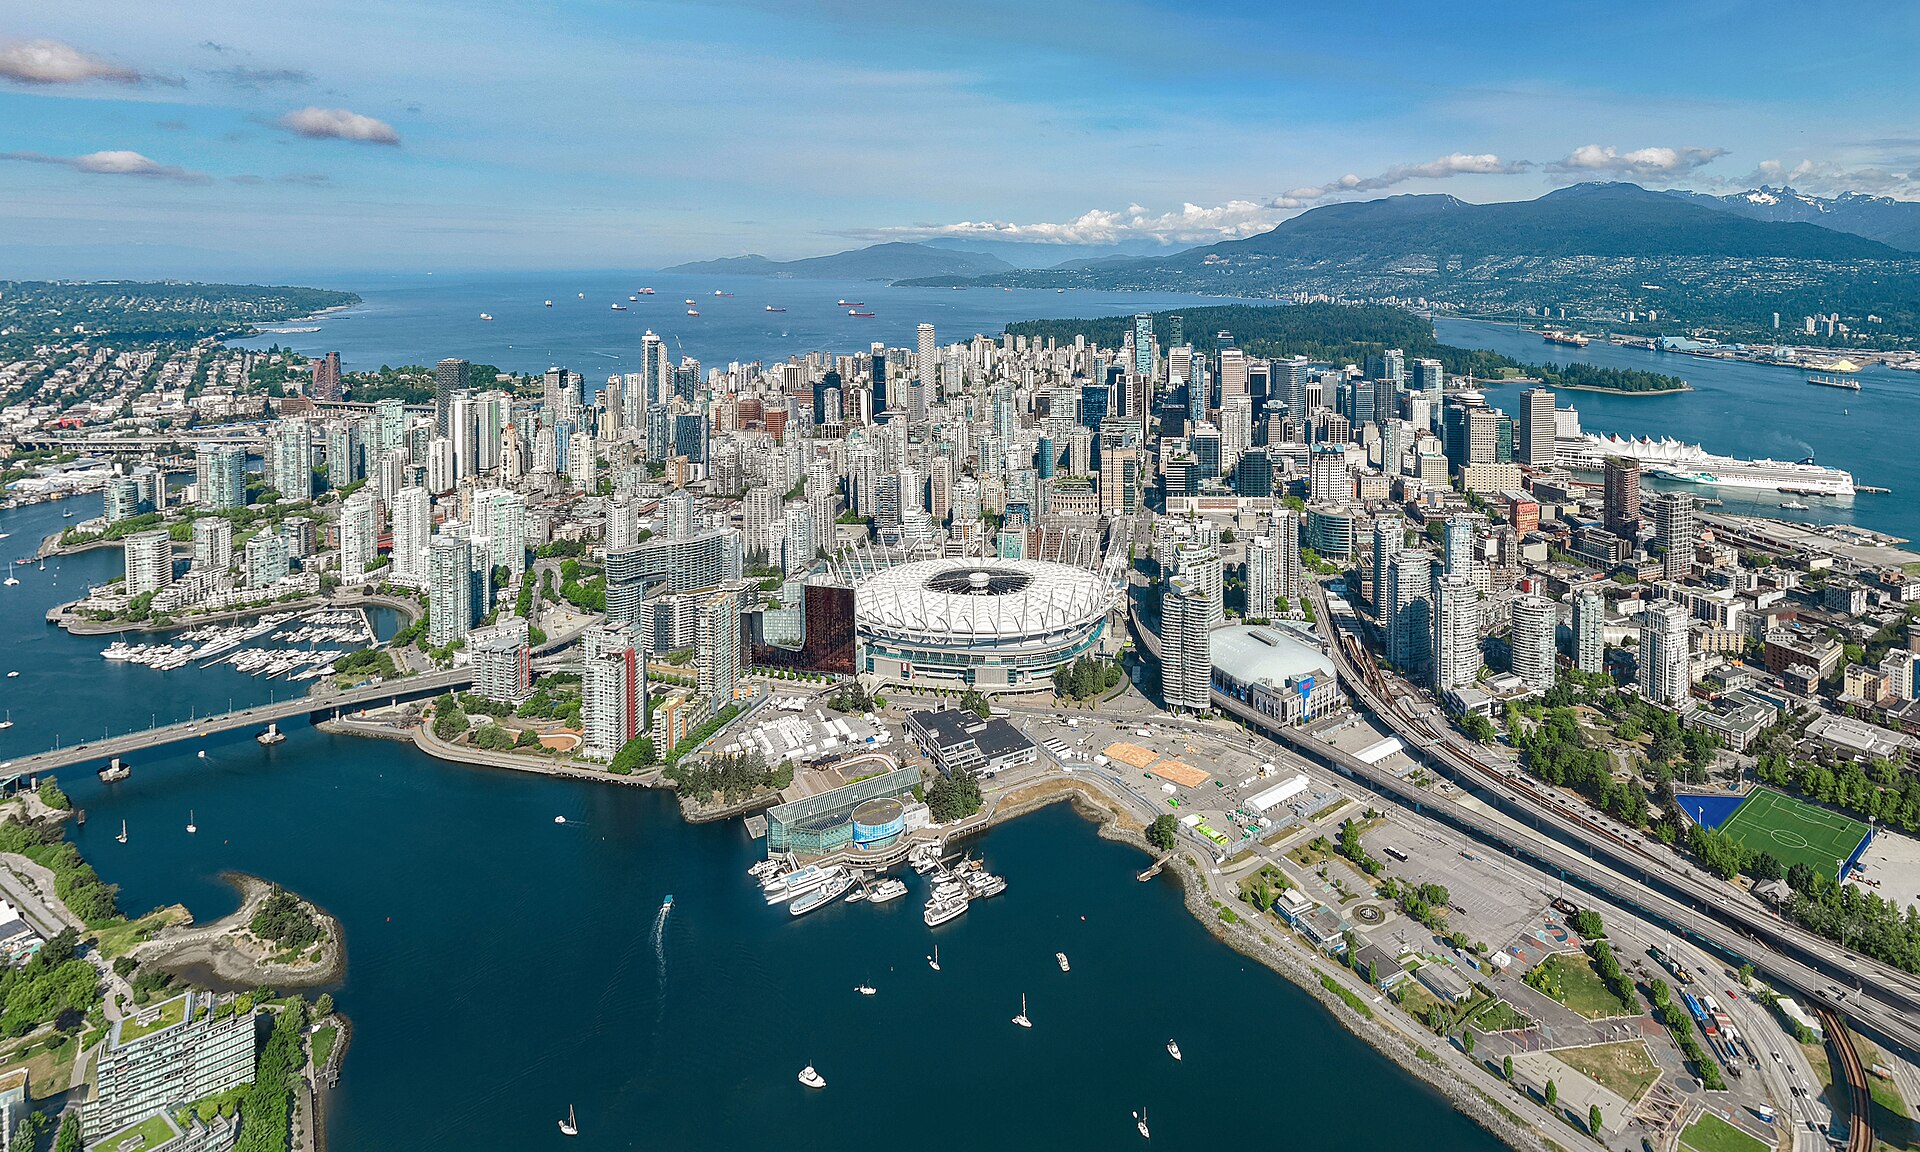


Both cities price housing as the central fact of life, so the decision turns on what you get for roughly the same pain. Toronto's benchmark home was $928,200 in July 2026 against Vancouver's $1,088,800, its two-bedroom rent was $2,045 against $2,638, and its Crime Severity Index of 54.99 was well under Vancouver's 83.51. Vancouver offers a January mean of 4.1 C against -5.0 C, 36.6 cm of snow against 114.5 cm, and a city where 41% of commuters walk, cycle or take transit. Toronto wins for career depth, cheaper rent and a safer metro. Vancouver wins for anyone who rates mild winters and mountains above a larger job market and who can cover the higher rent or mortgage.
| Measure | Vancouver | Toronto | Advantage |
|---|---|---|---|
| City population | 662,248 (2021) | 2,794,356 (2021) | Not directly comparable |
| Metro population | 3,088,036 (2025) | 6,202,225 (2021) | Not directly comparable |
| Five-year growth Growth is pressure on rents and roads as much as it is opportunity, so it is reported without a winner. | 4.9% (2016-2021) | 2.3% (2016-2021) | Not directly comparable |
What a home costs in each
The figures the two cities' rent-versus-buy and mortgage calculators run on, read from the same tables.
| Measure | Vancouver | Toronto | Advantage |
|---|---|---|---|
| Benchmark home price MLS® HPI or equivalent benchmark. Lower is treated as the advantage, which is the buyer's view rather than the owner's. | $1,088,800 (July 2026) | $928,200 (July 2026) | Toronto |
| Detached house benchmark | $1,822,900 | $1,455,200 | Toronto |
| Apartment or condominium benchmark | $688,000 | $551,900 | Toronto |
| Two-bedroom rent | $2,638/mo (average, October 2025) | $2,045/mo (average, October 2025) | Toronto |
| One-bedroom rent | $1,860/mo | $1,761/mo | Toronto |
| Two-bedroom rent against median income A year of two-bedroom rent as a share of the median household income below. A household paying the median rent out of the median income is a fiction, but it is the same fiction in both columns and it crosses currencies. | 35.2% of a year's income | 29.2% of a year's income | Toronto |
| Mortgage payment on the benchmark, 20% down 25-year amortization on Canadian semi-annual compounding, the convention in both. | $4,744/mo at 4.34% | $4,044/mo at 4.34% | Toronto |
| Price to household income Benchmark price divided by the median household income below. A ratio is comparable across currencies; the dollars are not. | 12.1× | 11.1× | Toronto |
| Property tax on the benchmark home The effective rate on market value, which is what the two rates have in common and what the Advantage column is decided on; the bills are in each city's own dollars. | $3,663/yr (0.336%, 2026) | $5,291/yr (0.57%, 2026) | Vancouver |
| Transfer tax on the benchmark home Compared as a share of the price. Where the seller pays it, it is a cost of leaving rather than arriving. | $19,776 (buyer pays) | $30,078 (buyer pays) | Vancouver |
| Rent control A cap protects a sitting tenant and does nothing for the next lease, so neither column is simply better. | 2.3% guideline (2026) | 2.1% guideline (2026) | Not directly comparable |
Vancouver: The 2026 total residential levy of $3.36394 per $1,000 of taxable value, including the provincial school, TransLink, BC Assessment, Metro Vancouver and MFA portions, before the Home Owner Grant. Toronto: About 0.57% of market value. Toronto levies 0.767311%, but against a Current Value Assessment frozen at 1 January 2016 values, because Ontario has deferred every reassessment since. MPAC's average Toronto assessment is $692,140 and the City's own worked example puts the bill on it at $5,311 for 2026, which on the $928,200 composite benchmark is 0.57%. That is the fourth-lowest rate on market value of the cities on this site, behind Vancouver, Kelowna and Victoria, and it produces almost exactly the same bill as Ottawa's 0.83%, because the home it is charged against costs 46% more.
How safe each city is, by the numbers it publishes
Police-reported figures for the most recent year each force or statistics agency has released. Rates describe a whole city or metro area, and the spread between neighbourhoods inside one city is usually wider than the gap between the two cities.
| Measure | Vancouver | Toronto | Advantage |
|---|---|---|---|
| Crime Severity Index Statistics Canada's weighted index for the metropolitan area, where 100 is Canada in 2006. American cities have no equivalent series. | 83.5 (2025) | 55.0 (2025) | Toronto |
| Violent crime per 100,000 | 709 (2025) | 987 (2025) | Vancouver |
| Property crime per 100,000 | 4,067 (2025) | 2,566 (2025) | Toronto |
| Homicides Counts, not rates, and a single year in a small city moves a long way on chance alone. What each figure covers is under the table. | 26 (2025) | 45 (2025) | Not directly comparable |
The Vancouver CMA Crime Severity Index fell from 92.33 in 2022 to 82.29 in 2024, then edged up 1.5% to 83.51 in 2025 while Canada's fell 5%. Within the city, VPD counts show violent crime down 15% from 6,288 incidents in 2023 to 5,343 in 2025 (the lowest rate in the five-year table) and property crime down 9% from its 2023 peak, while weapons offences and possession of stolen property rose sharply in 2025.
What the rates cover: City of Vancouver only (VPD), 5,343 violent Criminal Code incidents, 7.09 per 1,000 population, converted to per 100,000. Not a CMA figure.
Homicides: City of Vancouver (VPD culpable homicide). 11 of the 26 were victims of the April 2025 Lapu-Lapu Day festival vehicle attack; 2024 had 11 and 2023 had 15. About 3.5 per 100,000 on the city's 753,100 population estimate; the VPD table rounds the rate to 0.03 per 1,000.
The Toronto CMA Crime Severity Index climbed from 45.91 in 2021 to 59.43 in 2024, driven largely by auto theft, then fell 7.5% to 54.99 in 2025 with violent CSI down 13.7%. Toronto Police recorded 12,610 auto thefts in 2023, 9,676 in 2024 and 7,402 in 2025, and 2025 homicides (45) were the fewest since the 1980s.
What the rates cover: Police-reported violent Criminal Code violations, Toronto CMA, 69,297 actual incidents, table 35-10-0177-01
Homicides: Toronto Police Service public safety data portal count for the city (85 in 2024, 73 in 2023). Statistics Canada counts 64 homicides for the wider Toronto CMA in 2025, a rate of 0.91 per 100,000, down from 133 (1.90) in 2024
Winters, summers and what the weather can do to a house
| Measure | Vancouver | Toronto | Advantage |
|---|---|---|---|
| January mean | 4.1 °C | -5.0 °C | Not directly comparable |
| July mean | 18.2 °C | 22.1 °C | Not directly comparable |
| Precipitation a year | 1,160 mm | 807 mm | Not directly comparable |
| Snowfall a year | 37 cm | 115 cm | Not directly comparable |
| Sunshine a year | Not published | 2,066 hours | Not directly comparable |
Environment and Climate Change Canada 1991-2020 normals, Vancouver Int'l A (climate ID 1108395). January average 4.1 C, July 18.2 C, annual precipitation 1,159.5 mm with 174 mm in January and 34 mm in July, snowfall 36.6 cm a year. The 1991-2020 normals do not publish bright sunshine hours for this station, so the table shows no sunshine figure for Vancouver.
Hazards: Wildfire smoke from the BC Interior in late summer, heat events (the June 2021 heat dome), atmospheric river flooding in the Fraser Valley (November 2021), and Cascadia earthquake risk; no hurricanes or hail of note.
Environment and Climate Change Canada 1991-2020 normals at Toronto Pearson International Airport (climate ID 6158731): annual mean 8.6 C. The 1991-2020 normals do not publish sunshine; 2,066.3 hours is the 1981-2010 normal at the Toronto (City) station, climate ID 6158350.
Hazards: Humid summer heat warnings and winter cold snaps with lake-effect snow squalls; flash flooding from intense summer storms (July 2013 and July 2024 downpours flooded roads and the Don Valley); wildfire smoke advisories in some summers since 2023; occasional severe thunderstorms and hail, rare tornadoes.
What people earn and what the government takes
| Measure | Vancouver | Toronto | Advantage |
|---|---|---|---|
| Median household income | $90,000 CAD (2020) | $84,000 CAD (2020) | Vancouver |
| Unemployment rate | 6.0% (July 2026) | 6.7% (July 2026) | Vancouver |
| Sales tax | 12% | 13% | Vancouver |
| Top marginal income tax Federal plus provincial or state. The American figure leaves out payroll taxes and the cost of health insurance, both of which a Canadian household covers through the tax it pays here. | 53.5% | 53.53% | Vancouver |
| Income tax on $100,000, single filer Computed from each jurisdiction's brackets at a single filer's $100,000 and rounded to the dollar, so a gap of a dollar is rounding rather than tax. Two cities in one province or state are shown as Even, because there the two cells describe the same tax and whatever separates them is method. | $20,500 CAD | $21,200 CAD | Vancouver |
The Vancouver CMA unemployment rate was 6.0% in July 2026 after 6.6% in June, slightly under the national 6.4%. The regional labour market is service-heavy: the Port of Vancouver is Canada's largest, Metro Vancouver is North America's third-largest film and TV production centre, and YVR set a passenger record in 2025.
Main sectors: Port logistics and trade, Technology and digital media, Film and television production, Tourism and hospitality, Health care and education.
BC has no payroll tax on employees and MSP premiums were eliminated in 2020. Property transfer tax and the speculation and vacancy tax matter for buyers but are not income taxes.
Toronto's unemployment rate ran above the national rate through 2025 as population growth outpaced hiring, and TD Economics (October 2025) found trade-war exposed sectors such as transportation and warehousing and manufacturing shedding jobs and youth unemployment near one in five. The rate eased to 6.7% by July 2026.
Main sectors: Financial services and banking, Technology and software, Health care and life sciences, Professional services and education, Film, media and the arts.
No municipal income tax. Toronto levies a Municipal Land Transfer Tax on top of the provincial land transfer tax, and a Vacant Home Tax.
Whether you need a car
| Measure | Vancouver | Toronto | Advantage |
|---|---|---|---|
| System | TransLink (SkyTrain Expo, Millennium and Canada lines; bus; SeaBus; West Coast Express) | Toronto Transit Commission (subway, streetcar, bus, Wheel-Trans); GO Transit and UP Express (Metrolinx) for regional rail and bus | Not directly comparable |
| Commute by public transit | 22.9% (2021) | 26.2% (2021) | Toronto |
| Walk or cycle to work | 18.4% (2021) | 9.6% (2021) | Vancouver |
| Airport | Vancouver International Airport, YVR, 26.9 million passengers in 2025, an all-time record and 2.7% above 2024 (Vancouver Airport Authority, January 2026) | Toronto Pearson International Airport, YYZ, 47.3 million passengers in 2025 (up 1.1% from 46.8 million in 2024), per GTAA 2025 annual results. Billy Bishop Toronto City Airport (YTZ) serves short-haul flights from the waterfront. | Not directly comparable |
396.3 million boardings and 237.6 million journeys in 2025, down about 1.5% from 2024, the first annual decline since the pandemic recovery (TransLink figures reported by Daily Hive, 2026-03-25).
TTC carried 420 million trips in 2024 (204 million bus, 181 million subway, 35 million streetcar). The TTC's year-end projection for 2025 was 414 million rides, about 78% of 2019 levels, with 426.4 million forecast for 2026; a final audited 2025 total was not found.
Health care, schools and what each city is like
Health care
Care is paid for through BC's Medical Services Plan, which covers residents after a waiting period of up to three months with no premiums since January 2020; prescription drugs outside hospital fall under income-tested Fair PharmaCare or employer plans. Finding a family doctor is the practical problem: the province's Health Connect Registry reported about 1.4 million BC residents without a primary care provider in mid-2025, and the main acute hospitals are Vancouver General, St. Paul's (moving to a new False Creek site), and BC Children's.
Education
The University of British Columbia (Point Grey campus) and Simon Fraser University (Burnaby, with downtown campuses) are the two research universities, alongside Emily Carr, Langara, and BCIT. K to 12 is run by the Vancouver School Board (District 39), about 50,000 students in 87 elementary and 18 secondary schools, with French immersion and mini-school programs instead of charters; independent schools receive partial provincial funding.
Living there
A dense, mountainous coastal city where most of the region's jobs and housing sit within a few kilometres of water, and where the cost of housing shapes nearly every decision about where to live. Winters are mild, grey and wet from November to March; summers are dry and bright, increasingly interrupted by wildfire smoke. Day to day it is a transit-and-bike city by Canadian standards, with strong East Asian and South Asian communities and a visible drug and homelessness crisis concentrated in the Downtown Eastside.
Health care
Care is publicly funded through the Ontario Health Insurance Plan (OHIP), which covers physician and hospital services for residents with no premiums beyond the income-tested Ontario Health Premium collected through income tax; new residents wait up to three months for coverage, and prescription drugs, dental and vision are mostly private or employer insured. Toronto is home to the University Health Network (Toronto General, Toronto Western, Princess Margaret), Sunnybrook, St. Michael's, Mount Sinai and SickKids, but family-doctor shortages and long emergency-department and specialist waits are common.
Education
The University of Toronto, Toronto Metropolitan University and York University are in the city, with U of T consistently ranked in the global top 25. Publicly funded schools are run by four boards, the Toronto District School Board (the largest in Canada), the Toronto Catholic District School Board and two French-language boards, with specialized and alternative programs rather than US-style charters.
Living there
Toronto is a dense, fast-growing city of high-rise condos along the subway lines and low-rise neighbourhoods of brick semis in between, with more than half of residents born outside Canada. Housing costs are the central fact of life, and commutes by TTC, GO train or the 401 are long. Winters are grey and cold rather than extreme, summers humid, and the lakefront, ravines and Toronto Islands are where the city goes outside.
Where each city wins, and where it loses
Neither city is cheap, but Toronto is cheaper at every price point. Its composite benchmark was $928,200 in July 2026 against Vancouver's $1,088,800, and the gap widens by type: a Toronto detached house was $1,455,200 to Vancouver's $1,822,900, a row house $725,300 to $1,030,400, and an apartment $551,900 to $688,000. The benchmark mortgage with 20% down at 4.34% is $4,044 a month in Toronto and $4,744 in Vancouver. Renters see a bigger relative gap: a two-bedroom averaged $2,045 in Toronto and $2,638 in Vancouver in October 2025, a three-bedroom $2,294 against $3,291. Vancouver claws some back on carrying costs. Property tax on the benchmark is $3,663 against Toronto's $5,291, condo fees average $550 against $680, and transfer tax at purchase is $19,776 against $30,078, because Toronto charges a municipal land transfer tax on top of Ontario's. Rent control covers most existing BC tenancies at 2.3% for 2026; Ontario's 2.1% cap exempts any unit first occupied after November 2018.
Toronto is the safer metro on the 2025 figures. Its Crime Severity Index was 54.99 against Vancouver's 83.51, with Canada at 75.0, and Toronto's violent index of 71.57 sat below Vancouver's 80.67. The per-capita rates need a caveat: Toronto's violent rate of 987 per 100,000 and property rate of 2,566 are Statistics Canada CMA figures, while Vancouver's 709 violent and 4,067 property incidents per 100,000 are Vancouver Police counts for the city alone, so they are not the same geography and the violent figures should not be read as Vancouver being safer. Homicides tell a clearer story: Toronto's 45 in 2025 were its fewest since the 1980s, while Vancouver's 26 included the 11 killed in the April 2025 Lapu-Lapu Day festival attack. Trends diverge too. Toronto's CSI fell 7.5% in 2025 as auto theft dropped from 12,610 cases in 2023 to 7,402; Vancouver's edged up 1.5% while the country's fell 5%.
This is where Vancouver earns its price. January averages 4.1 C with 36.6 cm of snow a year; Toronto averages -5.0 C with 114.5 cm and lake-effect squalls. The cost is rain: 1,159.5 mm a year, 174 mm in January alone, and a grey stretch from November to March that some people find harder than cold. Toronto gets 806.8 mm and 2,066.3 hours of recorded sunshine; Vancouver's 1991-2020 normals do not publish a sunshine total. Summers flip the comparison: Vancouver's July mean of 18.2 C is dry and bright, Toronto's 22.1 C comes with humidity and heat warnings. For a house, Vancouver's hazards are Cascadia earthquake risk, the June 2021 heat dome and late-summer smoke from interior fires; Toronto's are flash floods like July 2013 and July 2024, which filled the Don Valley, plus occasional smoke since 2023. Home insurance on the benchmark runs $190 a month in Vancouver and $150 in Toronto.
Incomes are closer than house prices. The Vancouver CMA median household earned $90,000 in 2020 and the Toronto CMA $97,000; inside the city limits both were around $82,000 to $84,000. Unemployment was 6.0% in Vancouver in July 2026 and 6.7% in Toronto, which had peaked at 9.0% a year earlier as population growth outran hiring and trade-exposed sectors shed jobs. Toronto's economy is banking, software, life sciences and professional services, and its sheer size means more openings in any field. Vancouver's is the port, tech and digital media, film and television (North America's third-largest production centre) and tourism. BC taxes are slightly lighter: roughly $20,500 in income tax on a $100,000 salary against Toronto's $21,200 plus the $750 Ontario Health Premium, and 12% sales tax against 13% HST, with BC's PST skipping groceries, restaurant meals and many services. Call it $1,500 a year in Vancouver's favour, which covers about three months of the rent difference.
These are the two Canadian cities where a household can plausibly go without a car, and they do it differently. Toronto's transit commute share was 26.2% in 2021 against Vancouver's 22.9%, with the TTC carrying 420 million trips in 2024 on subway, streetcar and bus, plus GO trains for the region. Vancouver's 2021 walk-and-cycle share was 18.4%, nearly double Toronto's 9.6%, so combining the two puts Vancouver at about 41% of commuters outside a car against Toronto's 36%. TransLink's SkyTrain is automated and frequent; 396.3 million boardings in 2025 was a 1.5% dip, the first since the pandemic. Both Census figures were taken in May 2021 during work from home; Toronto's 2016 share was about 37%. Driving is worse in Toronto, where commutes on the 401 are long. Pearson handled 47.3 million passengers in 2025, YVR a record 26.9 million, and both are hubs with direct flights to Asia and Europe.
Both provinces cover doctors and hospitals with no premiums after a wait of up to three months, and both have a family doctor shortage: BC counted about 1.4 million residents without a primary care provider in mid 2025, and Toronto reports long emergency and specialist waits. Toronto's hospital roster is deeper, with the University Health Network, Sunnybrook, St. Michael's, Mount Sinai and SickKids; Vancouver has Vancouver General, St. Paul's and BC Children's. Schools are similar in structure. Toronto runs four public boards including the TDSB, Canada's largest, with specialized programs; Vancouver's District 39 has about 50,000 students with French immersion and mini-schools, and independent schools get partial provincial funding. U of T is ranked in the global top 25; UBC and SFU are both research universities. Toronto is a fast-growing city of 2.8 million where more than half of residents were born abroad; Vancouver is a denser, smaller city of about 662,000 in a metro of 3.1 million, with a visible drug and homelessness crisis in the Downtown Eastside.
What people underestimate is that the cities' price gaps pull in opposite directions depending on tenure. Renters pay a clear Vancouver premium, $593 a month on a two-bedroom and almost $1,000 on a three-bedroom. Buyers pay more up front in Vancouver but less every year after: the property tax difference of $1,628 and condo fee difference of $130 a month add up, and Toronto's extra $10,302 in transfer tax is gone the day you close. A household that buys an apartment and stays for a decade narrows the gap more than the headline benchmark suggests. A household that rents, moves every few years and wants the most career options should pick Toronto and use the savings to fly west in February.
Better here
- A January mean of 4.1 C and 36.6 cm of annual snow against Toronto's -5.0 C and 114.5 cm.
- Property tax on the benchmark is $3,663 a year against Toronto's $5,291, and transfer tax at purchase is $19,776 against $30,078.
- About 41% of city commuters walked, cycled or took transit in 2021, against 36% in Toronto, with an 18.4% walk-and-bike share nearly double Toronto's.
- Unemployment was 6.0% in July 2026 against Toronto's 6.7%, and the metro median household income of $90,000 is close to Toronto's $97,000.
- BC rent control covers most existing tenancies at 2.3% for 2026; Ontario's cap skips every unit built since November 2018.
- Income and sales taxes are about $1,500 a year lighter on a $100,000 salary, and PST does not apply to groceries or restaurant meals.
Worse here
- The benchmark home was $1,088,800 in July 2026 against Toronto's $928,200, and a detached house $1,822,900 against $1,455,200.
- A two-bedroom rented for $2,638 in October 2025 against $2,045 in Toronto, and a three-bedroom $3,291 against $2,294.
- The 2025 Crime Severity Index of 83.51 was above the national 75.0 and well above Toronto's 54.99, and it rose 1.5% while Canada's fell 5%.
- Annual precipitation of 1,159.5 mm, with 174 mm in January, makes for a grey five months.
- The metro sits on the Cascadia subduction zone, and late-summer wildfire smoke has become routine.
- A smaller job market: the metro has 3.1 million people against Toronto's 7.1 million, and fewer head offices.
Choose Vancouver if
- you will take rain over -5 C and snow, and want mountains and ocean within the city
- you can cover $593 a month more in rent, or plan to buy and stay long enough for lower property tax to matter
- you want to commute on foot, by bike or on SkyTrain without owning a car
- you work in film, tech, port logistics or tourism rather than finance
The Vancouver guide · Neighbourhoods · Vancouver rent vs buy · Vancouver mortgage calculator
Better here
- The benchmark home was $928,200 in July 2026 against Vancouver's $1,088,800, and the mortgage with 20% down is $4,044 a month against $4,744.
- A two-bedroom rented for $2,045 in October 2025 against Vancouver's $2,638.
- The 2025 Crime Severity Index of 54.99 was far below Vancouver's 83.51, and 45 homicides were the fewest since the 1980s.
- The metro median household earned $97,000 in 2020 against Vancouver's $90,000, in a much larger market for finance, software and life sciences.
- The TTC carried 420 million trips in 2024 and 26.2% of commuters used transit in 2021, the highest share in Canada.
- 2,066.3 hours of recorded sunshine a year and 806.8 mm of precipitation against Vancouver's 1,159.5 mm.
Worse here
- January averages -5.0 C with 114.5 cm of snow and lake-effect squalls; summers at 22.1 C are humid with heat warnings.
- Property tax on the benchmark is $5,291 against $3,663, and the municipal land transfer tax pushes transfer tax to $30,078 against $19,776.
- Condo fees average $680 a month against Vancouver's $550.
- Unemployment peaked at 9.0% in July 2025 and was still 6.7% in July 2026, above Vancouver's 6.0%.
- Violent crime ran 987 per 100,000 in the CMA in 2025, and the index climbed from 45.91 in 2021 to 59.43 in 2024 before easing.
- Only 9.6% of commuters walked or cycled in 2021, and commutes on the 401 or GO are long.
Choose Toronto if
- you rent and want $593 a month back on a two-bedroom
- you work in banking, consulting, law or any field where the deepest Canadian job market matters
- you want the lowest crime index of the two and a children's hospital like SickKids nearby
- you can live with a real winter in exchange for a $160,600 lower benchmark
The Toronto guide · Neighbourhoods · Toronto rent vs buy · Toronto mortgage calculator
Vancouver or Toronto, in short
Is Vancouver or Toronto cheaper to live in?
Toronto, especially for renters. A two-bedroom averaged $2,045 in Toronto and $2,638 in Vancouver in October 2025. The July 2026 benchmark home was $928,200 in Toronto against $1,088,800 in Vancouver, and the mortgage with 20% down was $4,044 a month against $4,744. Vancouver recovers some ground on ownership costs: property tax on the benchmark is $3,663 against $5,291, condo fees $550 against $680, and transfer tax $19,776 against $30,078. BC income and sales taxes are roughly $1,500 a year lighter on a $100,000 salary. All figures are in Canadian dollars.
Is Vancouver or Toronto safer?
Toronto, on the 2025 Statistics Canada figures. The Toronto CMA Crime Severity Index was 54.99 and Vancouver's 83.51, against a national 75.0; Toronto's violent index was 71.57 to Vancouver's 80.67. Toronto recorded 45 homicides in the city, the fewest since the 1980s; Vancouver recorded 26, eleven of them in the Lapu-Lapu Day attack. Be careful with the per-100,000 rates on the page: Toronto's are CMA figures and Vancouver's are city-only police counts, so the 709 versus 987 violent comparison is not like for like.
Which has the better climate, Vancouver or Toronto?
Vancouver for winter, Toronto for sun. Vancouver's January mean is 4.1 C with 36.6 cm of snow a year; Toronto's is -5.0 C with 114.5 cm. Vancouver pays with 1,159.5 mm of annual precipitation, most of it between November and March, against Toronto's 806.8 mm and 2,066.3 hours of recorded sunshine. Summers favour Vancouver: a dry 18.2 C July against Toronto's humid 22.1 C. Vancouver carries earthquake risk and late-summer smoke; Toronto has flash floods and humid heat warnings.
Can you live without a car in Vancouver or Toronto?
Yes in both, more so than anywhere else in Canada. In the 2021 Census, 26.2% of Toronto commuters took transit and 9.6% walked or cycled; in Vancouver the shares were 22.9% and 18.4%, so slightly more Vancouver commuters were outside a car. The TTC carried 420 million trips in 2024 and TransLink 396.3 million boardings in 2025. Both counts were taken during pandemic work from home and understate normal use; Toronto's 2016 transit share was about 37%. Outside the core, both regions still assume a car.
Where the figures come from
Housing figures are the ones behind each city's calculators, dated on those pages. The rest are listed here with the date they were retrieved. See the methodology for how facts, estimates and opinion are kept apart.
- Census Profile, 2021 Census of Population: Vancouver, City (CY) and Vancouver (CMA) · Statistics Canada · retrieved Supports: City population, population.metro (2021 count), Five-year growth, Median household income, Transit commute share, Walk and cycle commute share
- Population estimates, July 1, by census metropolitan area and census agglomeration (table 17-10-0148-01) · Statistics Canada · retrieved Supports: Metro population
- The Daily: Canada's population estimates, subprovincial areas, 2025 · Statistics Canada · retrieved Supports: population.growthPct5y note
- Crime severity index and weighted clearance rates, Canada, provinces, territories and Census Metropolitan Areas (table 35-10-0026-01) · Statistics Canada · retrieved Supports: Crime Severity Index, Crime trend
- Police-reported Crime Severity Index and crime rate, by census metropolitan area, 2025 · Statistics Canada, The Daily · retrieved Supports: crime.index note (crime rate, Canada CSI)
- Vancouver Police Department Crime Incident and Crime Rate Statistics, 2021-2025 · Vancouver Police Department · retrieved Supports: Violent crime rate, Property crime rate, Homicides, Crime trend, population.city note
- Violent crime in Vancouver reaches 20-year low, according to VPD report · CTV News Vancouver · retrieved Supports: Crime trend
- Canadian Climate Normals 1991-2020, Vancouver International (Airport) · Environment and Climate Change Canada · retrieved Supports: January mean, July mean, Annual precipitation, Annual snowfall
- The Daily: Labour Force Survey, July 2026 · Statistics Canada · retrieved Supports: Unemployment rate, Labour market
- Personal income tax rates · Government of British Columbia · retrieved Supports: Top marginal income tax, Income tax on $100,000
- BC 2025 and 2026 Tax Rates and Tax Brackets · TaxTips.ca · retrieved Supports: Top marginal income tax, taxes.incomeTaxAt100k (federal brackets and basic personal amount)
- Provincial sales tax (PST) · Government of British Columbia · retrieved Supports: Sales tax
- MSP premiums · Government of British Columbia · retrieved Supports: Health care, Tax notes
- TransLink ridership sees decline in 2025, partly due to fewer young adults · Daily Hive Urbanized · retrieved Supports: Transit ridership
- YVR breaks all-time cargo and passenger records in 2025 · Vancouver Airport Authority · retrieved Supports: Airport passengers, Labour market
- Key sectors underpin Metro Vancouver's growth ambitions · Western Investor · retrieved Supports: Main sectors, Labour market
- 1.4M in B.C. Have No Family Doctor. Most Aren't Listed · The Canada Report · retrieved Supports: Health care
- Our District · Vancouver School Board · retrieved Supports: Education
- Vancouver · Wikipedia · retrieved Supports: point
- Population and dwelling counts: Census metropolitan areas, census agglomerations and census subdivisions (table 98-10-0003-01) · Statistics Canada · retrieved Supports: Metro population, Five-year growth
- Census Profile, 2021 Census of Population, Toronto, City (CSD), Ontario (98-401-X2021005 CSV) · Statistics Canada · retrieved Supports: City population, Five-year growth, Median household income, Transit commute share, Walk and cycle commute share
- Household income statistics by dwelling and household characteristics, census metropolitan areas (table 98-10-0061-01) · Statistics Canada · retrieved Supports: Median household income
- Incident-based crime statistics, by detailed violations, police services in Ontario (table 35-10-0177-01) · Statistics Canada · retrieved Supports: Violent crime rate, Property crime rate, Homicides
- The Daily: Police-reported crime statistics in Canada, 2025 · Statistics Canada · retrieved Supports: Crime Severity Index, Crime trend
- Homicides Open Data (ArcGIS feature service, Public Safety Data Portal) · Toronto Police Service · retrieved Supports: Homicides, Crime trend
- Auto Theft Open Data (ArcGIS feature service, Public Safety Data Portal) · Toronto Police Service · retrieved Supports: Crime trend
- Murders dropped sharply in several major Canadian cities last year, data show · The Globe and Mail · retrieved Supports: Homicides
- Canadian Climate Normals 1991-2020, Toronto Pearson (Airport) · Environment and Climate Change Canada · retrieved Supports: January mean, July mean, Annual precipitation, Annual snowfall
- Canadian Climate Normals 1981-2010, Toronto (City) · Environment and Climate Change Canada · retrieved Supports: Sunshine hours
- Hogtown Blues: Toronto's Lagging Jobs Market · TD Economics · retrieved Supports: Labour market
- 2025 and 2026 Combined Federal and Ontario Tax Rates Including Surtaxes · TaxTips.ca · retrieved Supports: Top marginal income tax, Income tax on $100,000
- Ontario sales tax: 13% HST rates, registration, and compliance guide · Xero · retrieved Supports: Sales tax
- 34 billion rides and counting: the TTC reaches new service milestone · Toronto Transit Commission · retrieved Supports: Transit ridership
- TTC ridership declined this past fall, despite stricter return-to-office policies for workers · CP24 · retrieved Supports: Transit ridership
- GTAA Reports 2025 Annual Results · Greater Toronto Airports Authority (via Newswire) · retrieved Supports: Airport passengers
- Metro Vancouver home sales lose brief momentum: July 2026 statistics · Greater Vancouver REALTORS® · retrieved Supports: Composite benchmark price of $1,088,800 in July 2026, down 6.2% year over year, Benchmark prices by property type, with every type down on the year
- Rental Market Survey: Vancouver (CY), average rent by bedroom type, October 2025 · Canada Mortgage and Housing Corporation · retrieved Supports: One-bedroom average rent of $1,860, Two-bedroom average rent of $2,638, Metro vacancy rate of 3.7%
- Property tax rates · City of Vancouver · retrieved Supports: 2026 total residential levy of $3.36394 per $1,000 of taxable value
- Home owner grant · Province of British Columbia · retrieved Supports: The grant of up to $570 on an eligible principal residence
- Premium information for homeowner and small rental loans · Canada Mortgage and Housing Corporation · retrieved Supports: Mortgage default insurance premium rates by loan-to-value
- Regulations amending the Insurable Housing Loan Regulations and the Eligible Mortgage Loan Regulations (SOR/2025-55) · Canada Gazette, Part II · retrieved Supports: The $1.5 million insured price cap, 30-year amortization for first-time buyers and new builds
- Minimum qualifying rate for uninsured mortgages · Office of the Superintendent of Financial Institutions · retrieved Supports: The qualifying rate of the contract rate plus two points, or 5.25%
- Interest rates charged for new and existing lending by chartered banks · Bank of Canada · retrieved Supports: The default mortgage rate of 4.34%, uninsured five-year-plus fixed, funds advanced May 2026
- Property transfer tax · Province of British Columbia · retrieved Supports: Transfer tax brackets, First-time buyer and new build exemptions
- Rent increases · Province of British Columbia · retrieved Supports: 2026 rent increase guideline of 2.3%
- Market Watch, July 2026 · Toronto Regional Real Estate Board · retrieved Supports: A City of Toronto MLS® HPI composite benchmark of $928,200 in July 2026, down 3.83% year over year, City of Toronto benchmarks of $1,455,200 single-family detached (down 4.40%), $1,146,300 single-family attached (down 4.00%), $725,300 townhouse (down 5.75%) and $551,900 apartment (down 7.09%), An All TRREB Areas composite benchmark of $934,600, down 4.63%, covering the region rather than the City, A GTA average selling price of $1,003,956 in July 2026, down 4.5% year over year, 5,995 sales, 14,484 new listings (down 17.8%) and 26,098 active listings (down 12.1%) in July 2026, District benchmarks for Toronto C02 ($1,302,900 composite, detached down 2.15%, apartment down 14.65%), C14 ($888,100), E07 ($735,600) and W06 ($814,300)
- Rental Market Survey: Toronto, average rent by bedroom type, October 2025 · Canada Mortgage and Housing Corporation · retrieved Supports: Toronto CMA average purpose-built rents of $1,491 bachelor, $1,761 one-bedroom, $2,045 two-bedroom and $2,294 three-bedroom-plus, An overall purpose-built average of $1,917, A Toronto CMA purpose-built vacancy rate of 3.0%, the highest since 2021
- Property tax rates and fees, 2026 · City of Toronto · retrieved Supports: A 2026 total residential rate of 0.767311%: 0.605295% city, 0.153% education and 0.009016% City Building Fund, The City's own worked example of $692,140 of assessment at 0.767311%, which is $5,311, Education rates set by the province and city rates set by council
- City of Toronto's 2026 Budget now final · City of Toronto · retrieved Supports: A combined 2026 residential property tax and City Building Fund increase of 2.2%, MPAC's average Toronto current value assessment of $692,140, An increase of $91.53 a year, or $7.63 a month, on that average assessment
- Municipal Land Transfer Tax rates and fees · City of Toronto · retrieved Supports: A municipal land transfer tax charged on top of the provincial one, on Toronto purchases only, Brackets of 0.5%, 1%, 1.5%, 2%, 2.5% and 4.4%, with further bands above $3,000,000, A first-time buyer rebate of up to $4,475 of the municipal tax
- Calculating Land Transfer Tax · Ontario Ministry of Finance · retrieved Supports: Provincial transfer tax brackets, The conditional 2.5% band
- Residential rent increases · Government of Ontario · retrieved Supports: 2026 rent increase guideline of 2.1%, The 2018 occupancy exemption
- Retail Sales Tax · Government of Ontario · retrieved Supports: 8% retail sales tax on insurance premiums